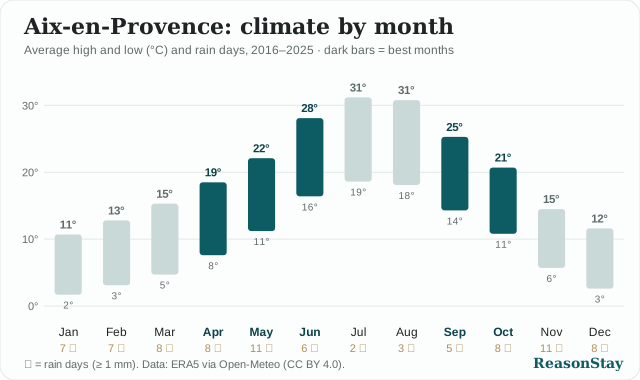
Free climate charts for travel writers
Writing about a city trip? Put a clear climate chart in your article: average high and low for every month, rain days, and the best months to go. 150 cities in 34 countries, free to use.
- How: click "Copy embed code" and paste it into your post as HTML. The chart stays sharp at any size.
- Licence: CC BY 4.0 — keep the credit line under the chart.
- Data: ten-year monthly normals from ERA5 (via Open-Meteo); the best months follow one published rule. The raw numbers are on Open data.
- Need another city or a different chart? Write to hello@reasonstay.com.
No city matches. Try a country name.
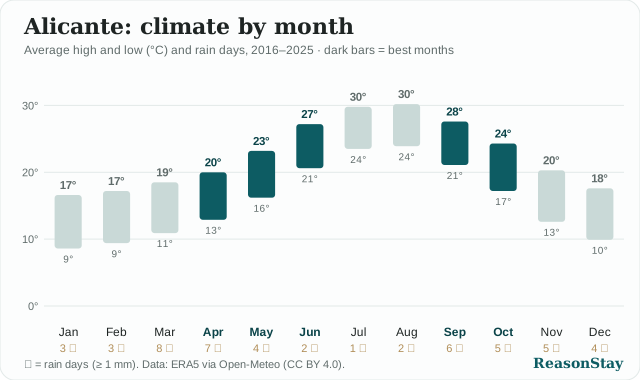
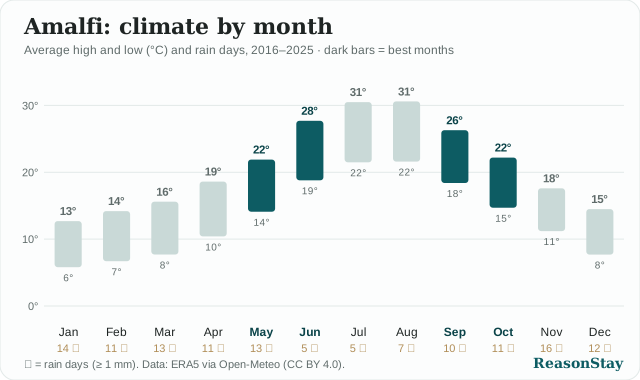
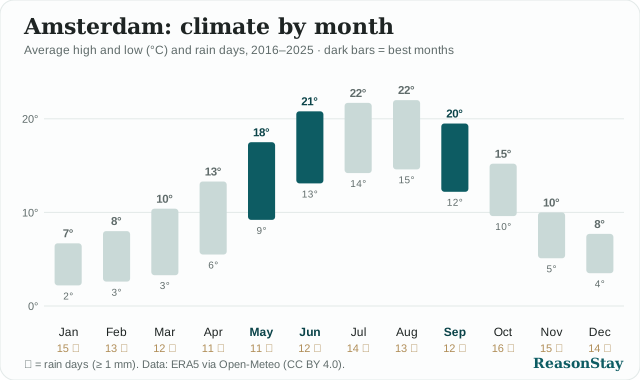
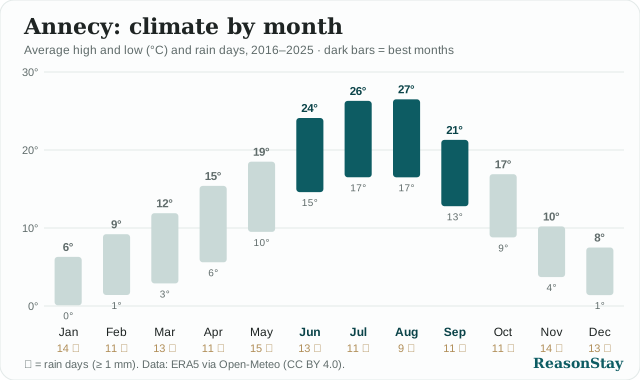
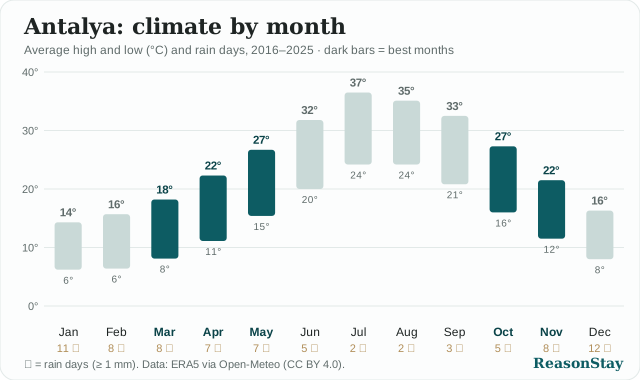
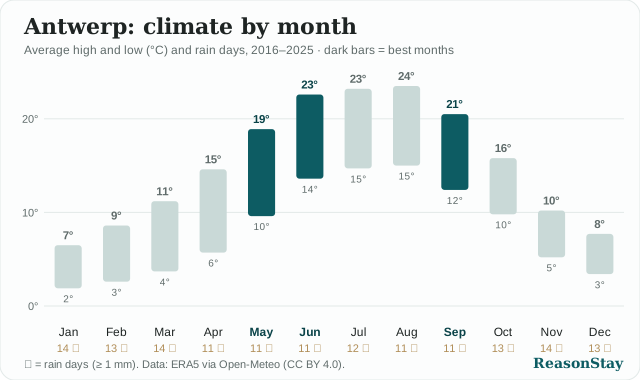
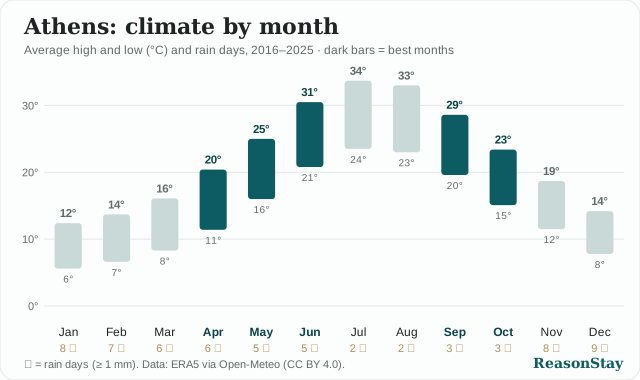
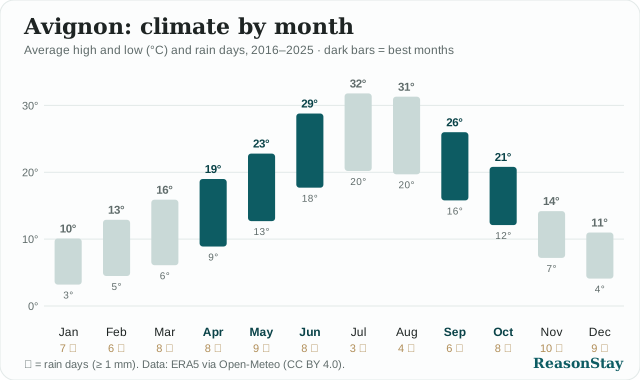
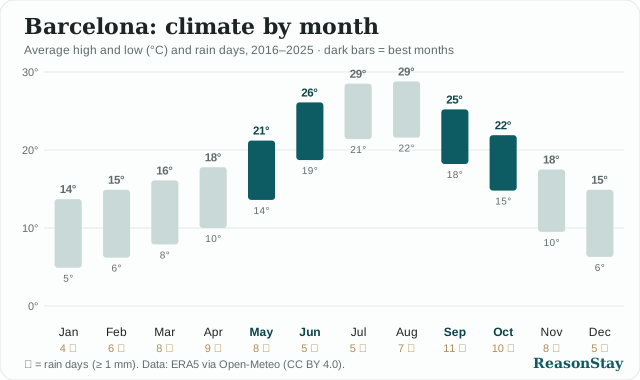
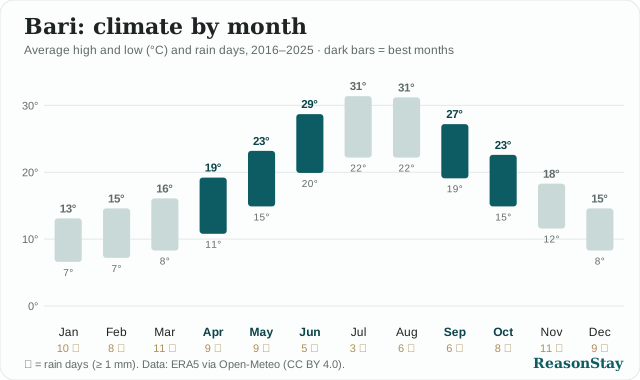
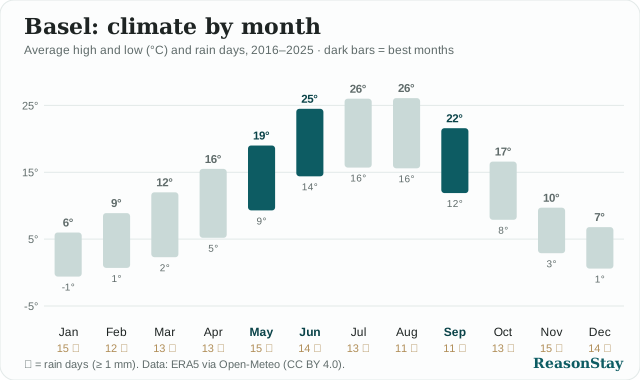
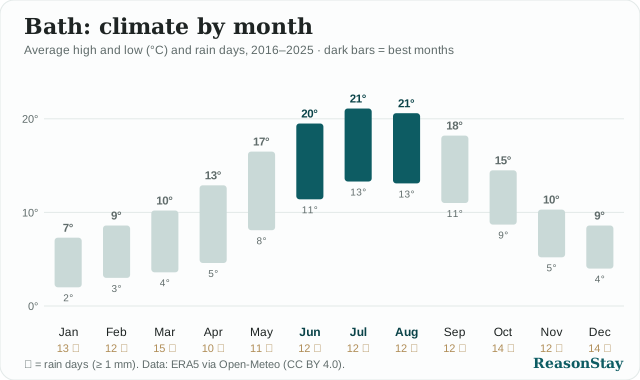
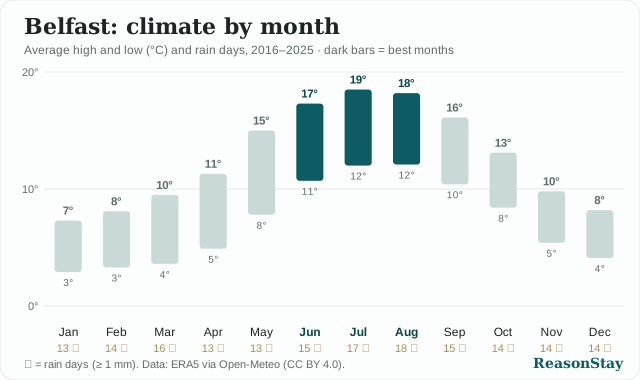
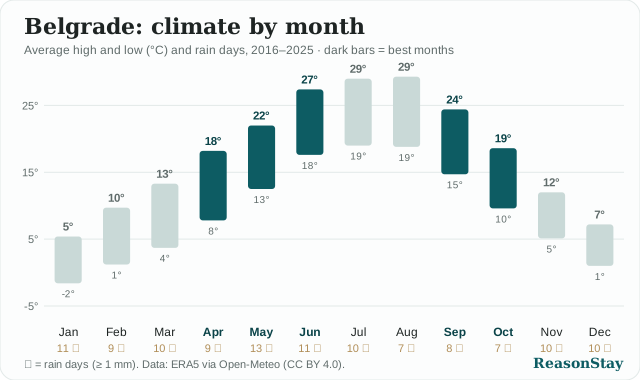
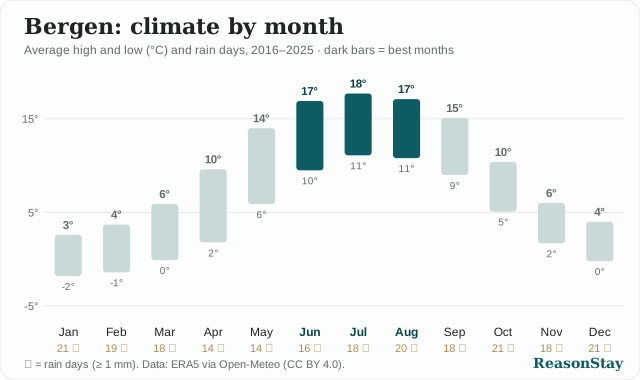
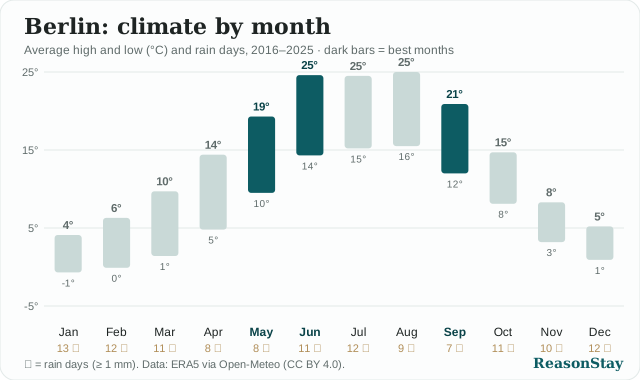
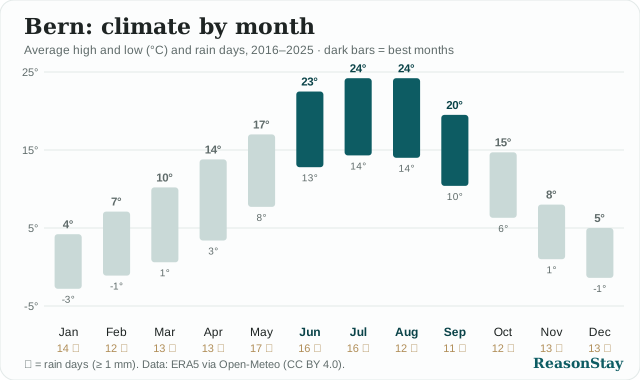
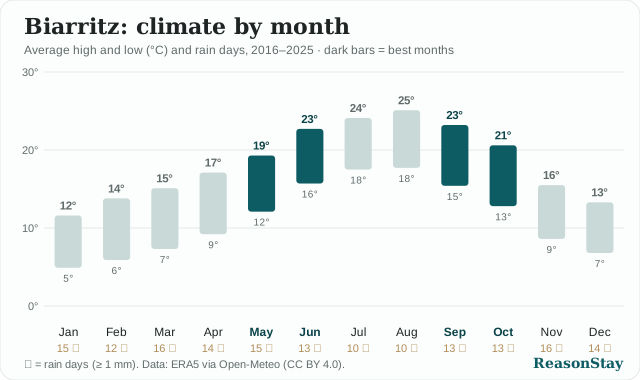
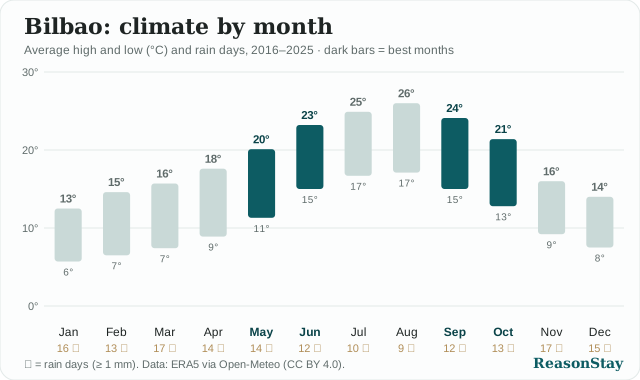
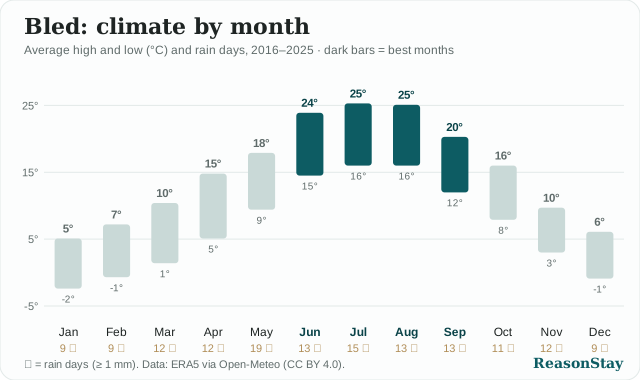
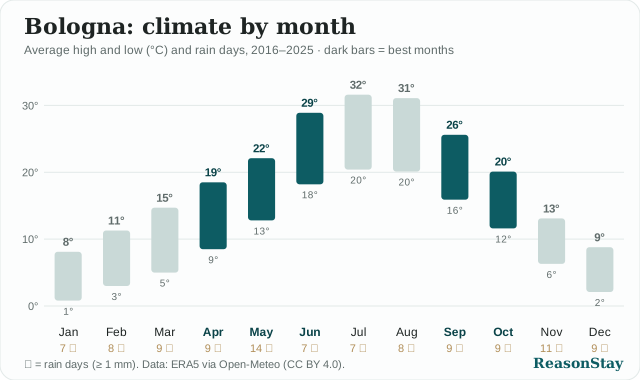
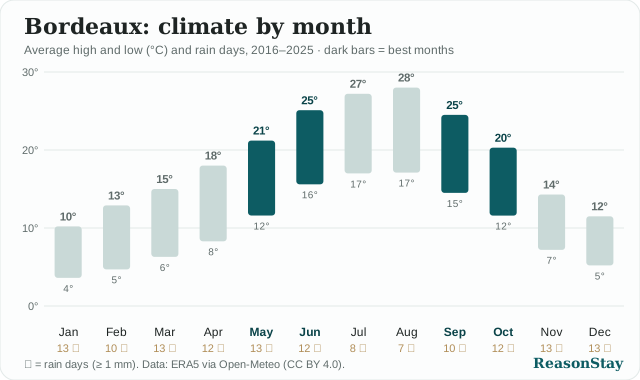
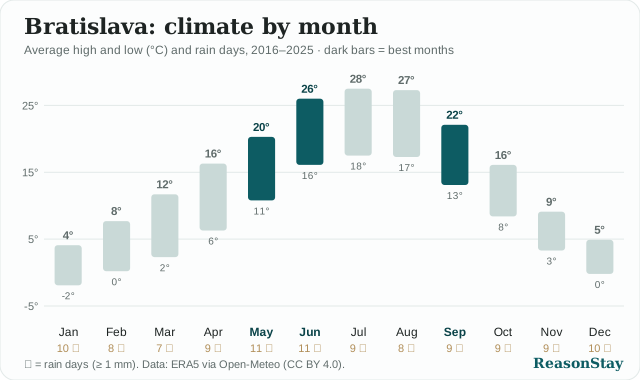
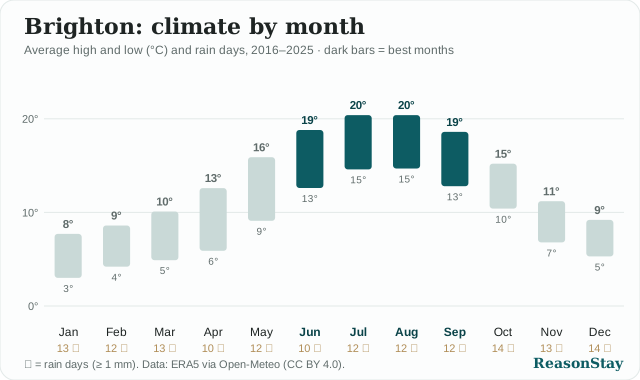
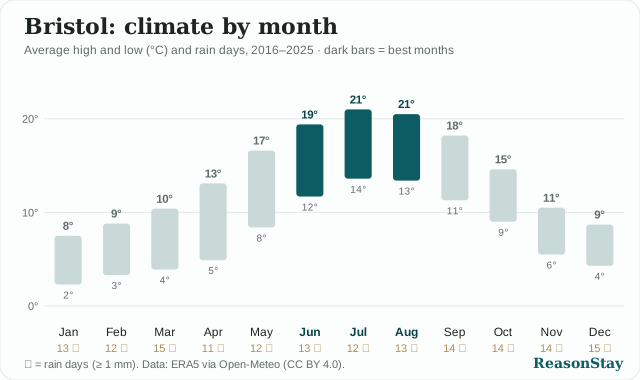
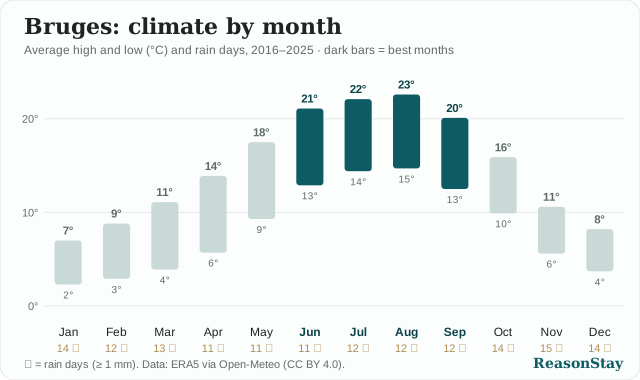
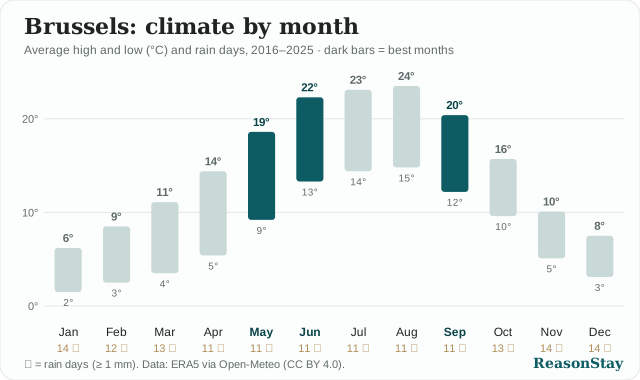
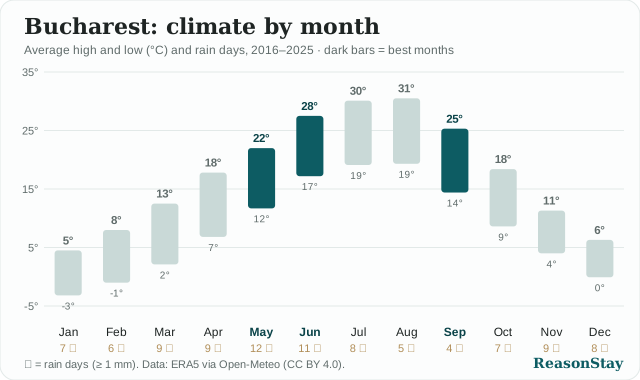
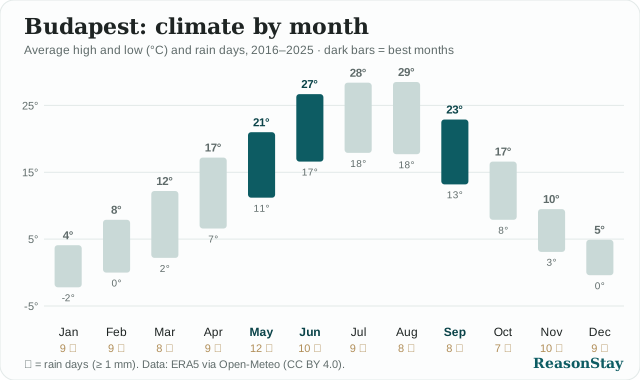
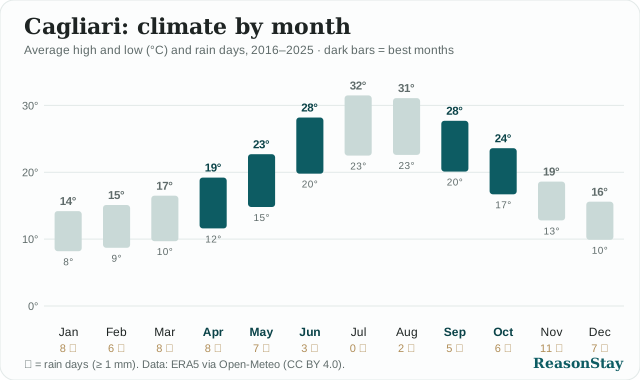
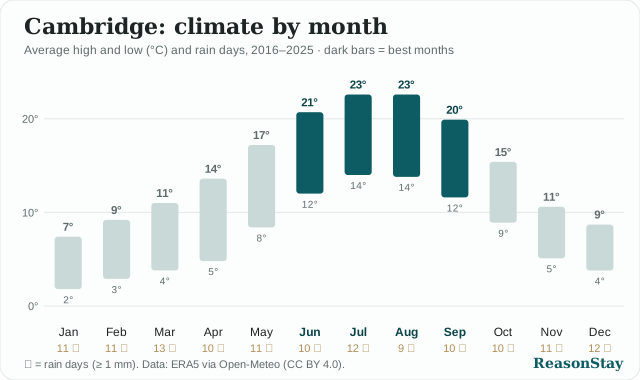
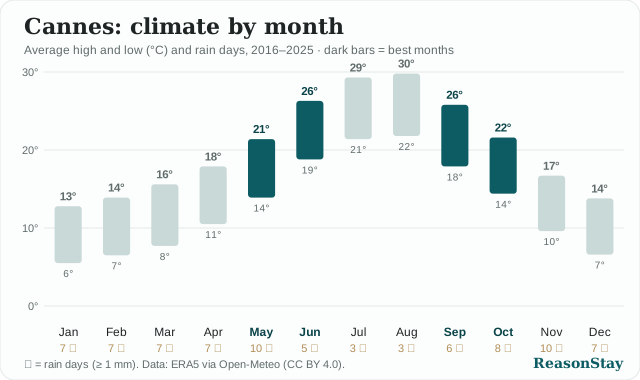
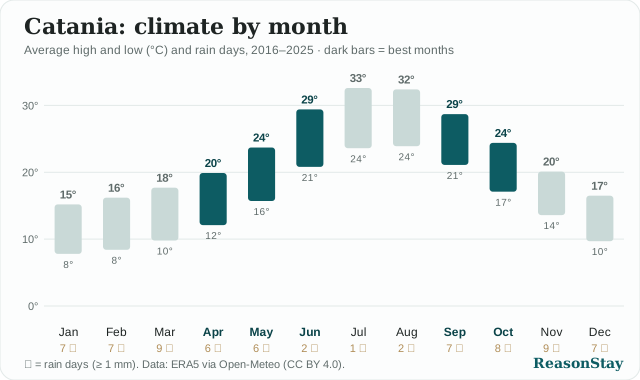
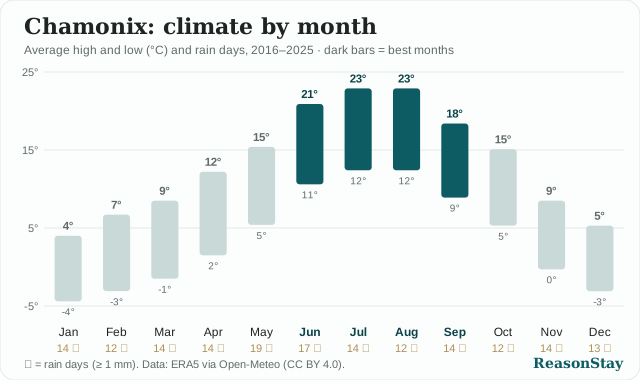
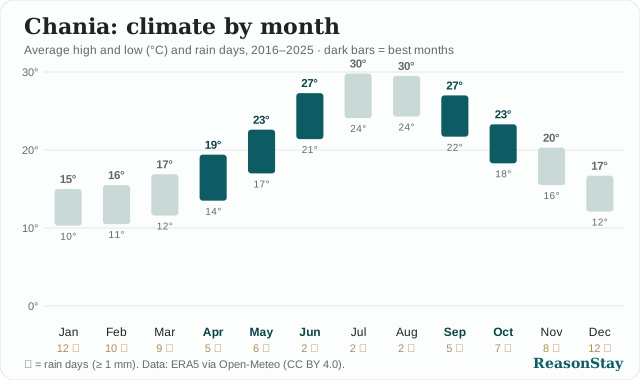
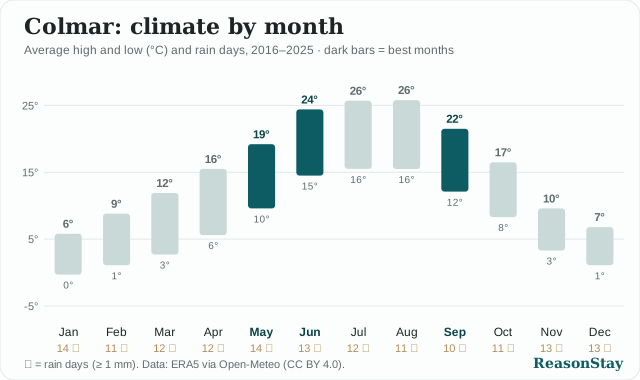
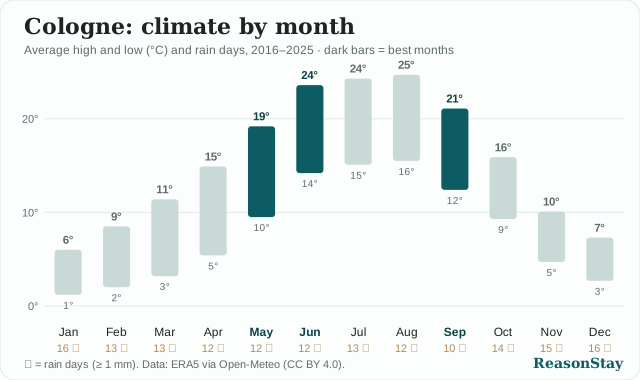
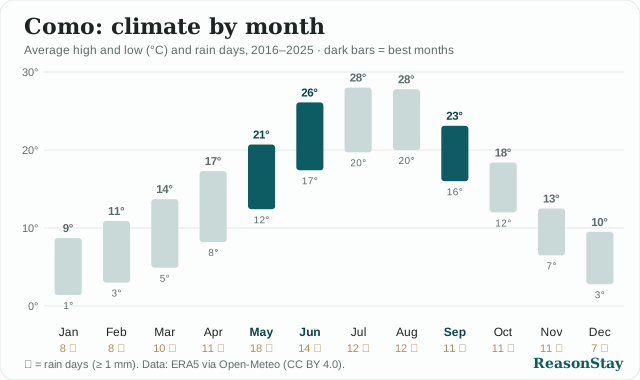
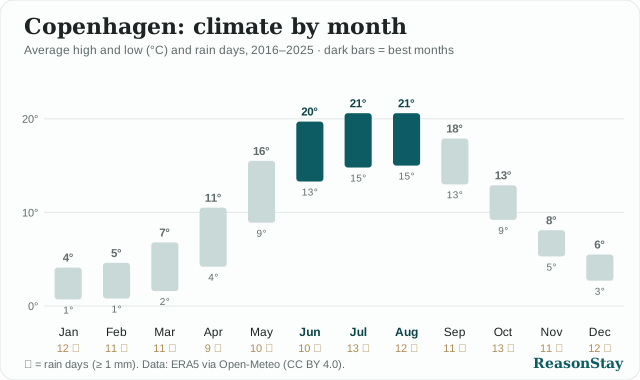
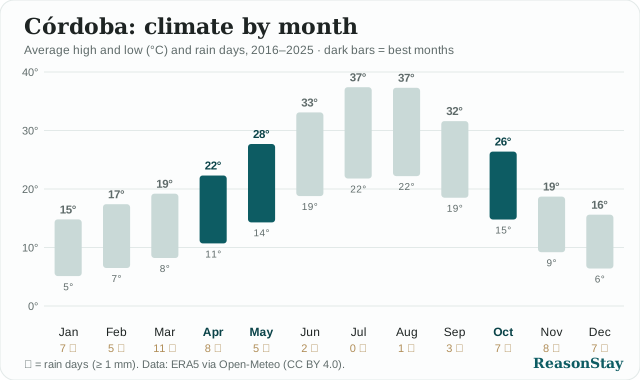
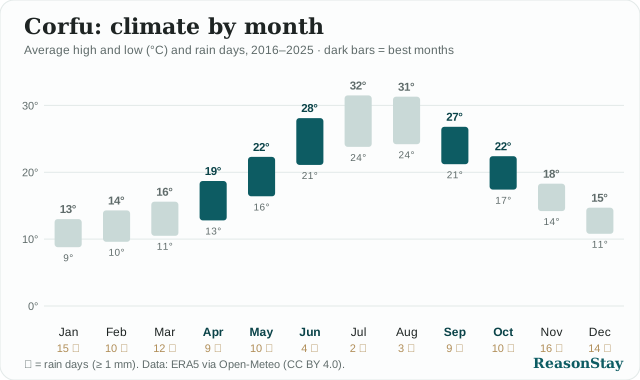
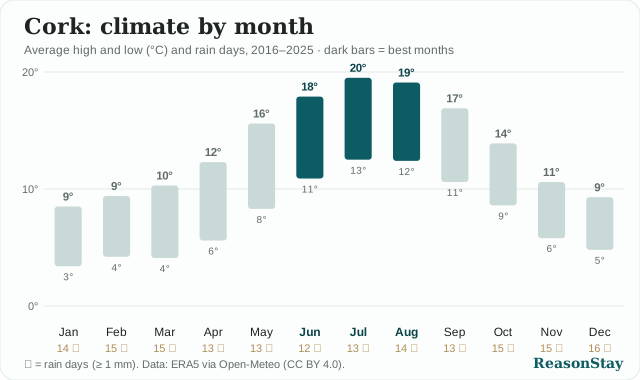
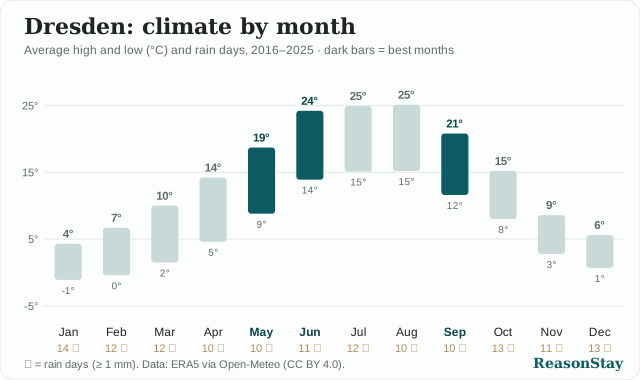
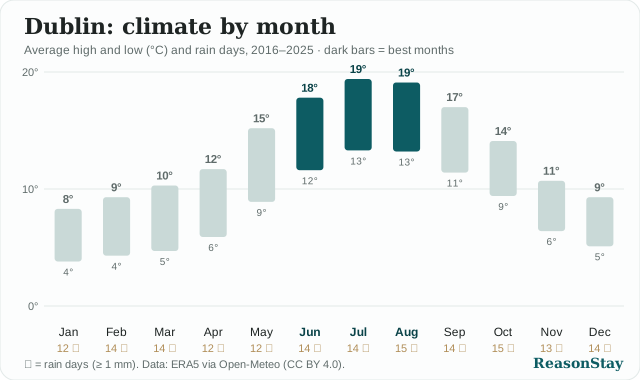
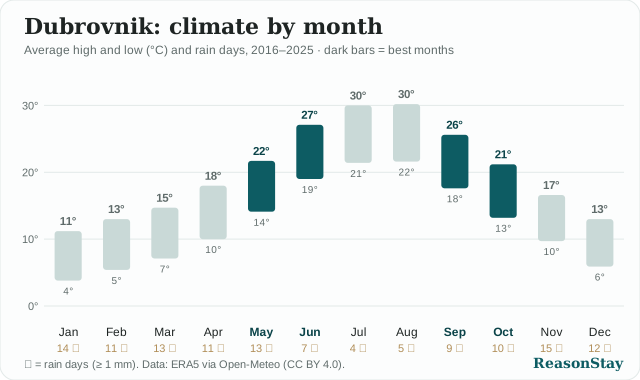
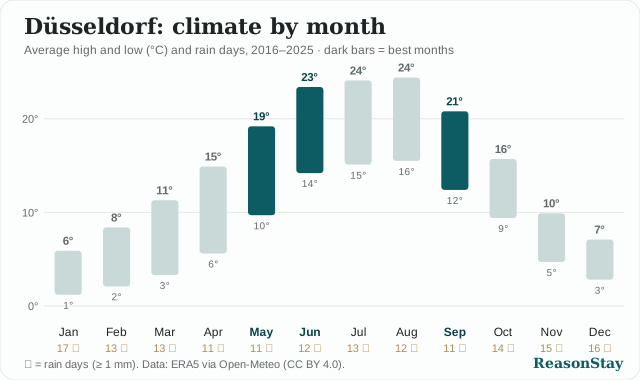
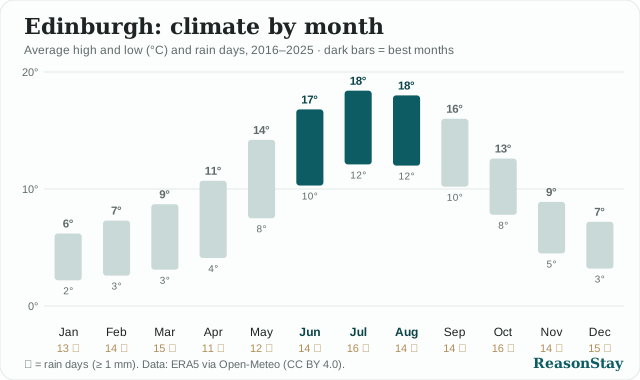
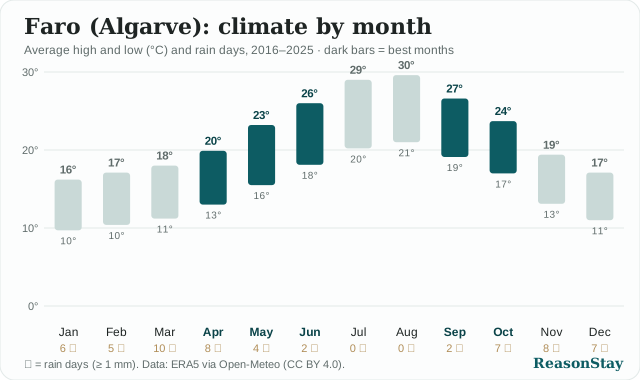
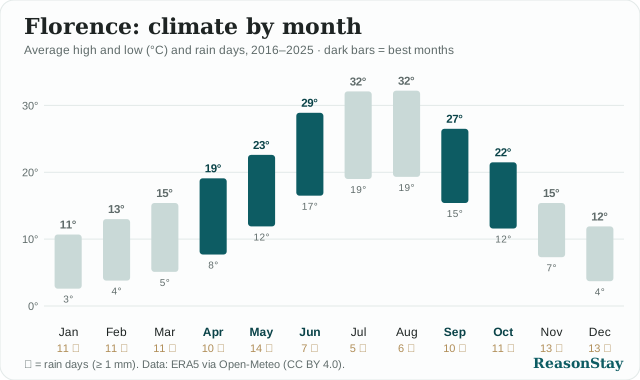
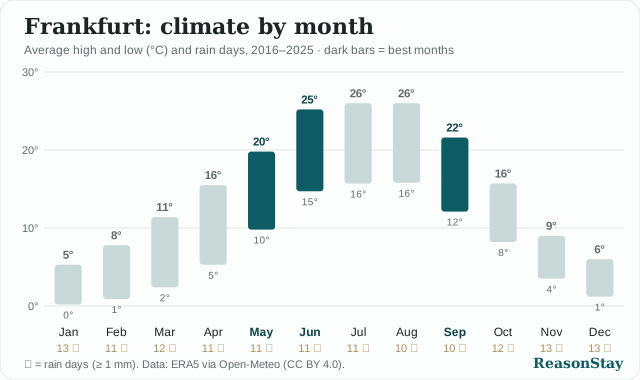
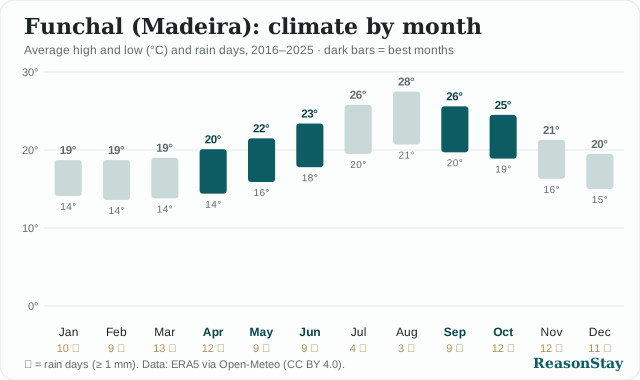
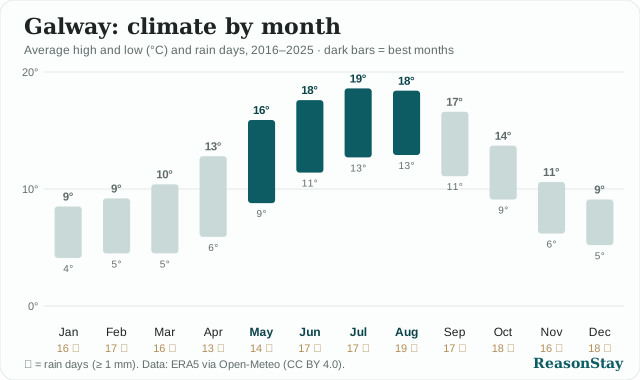
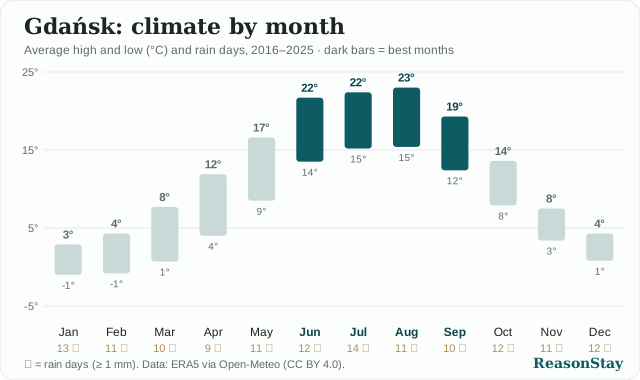
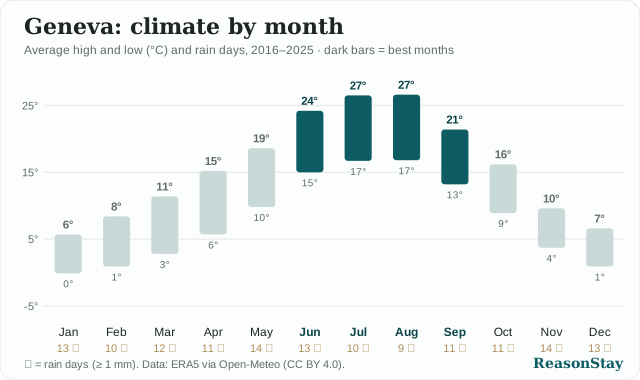
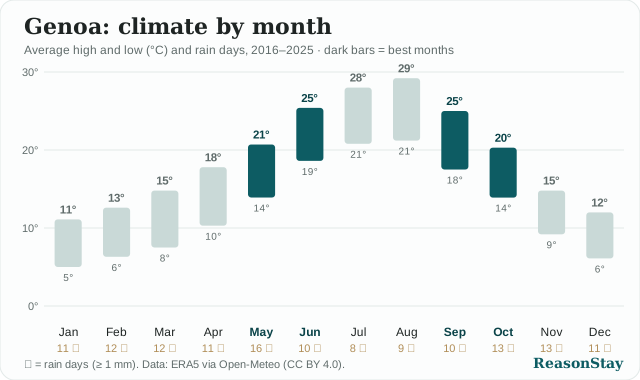
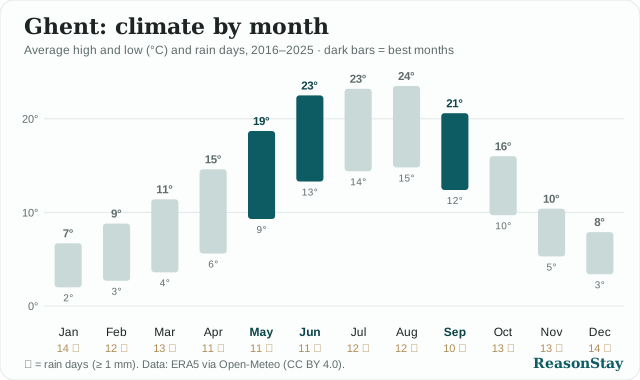
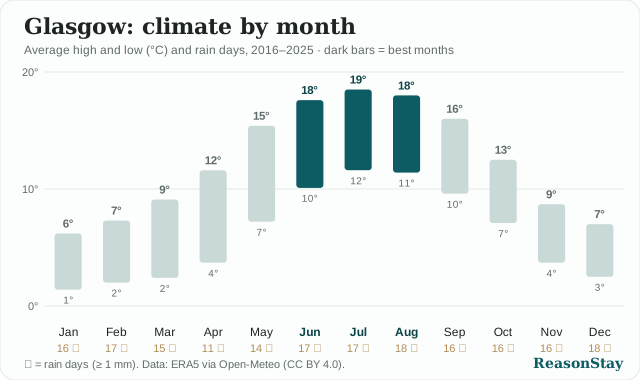
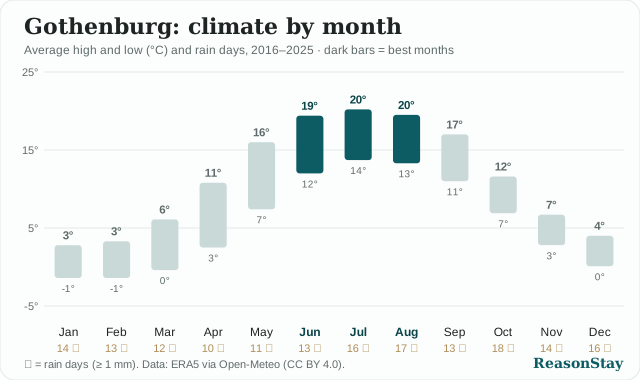
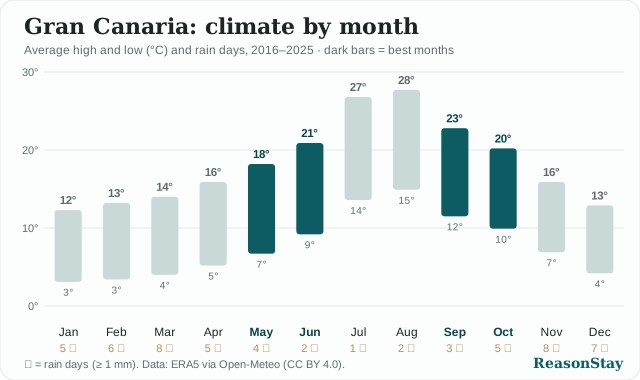
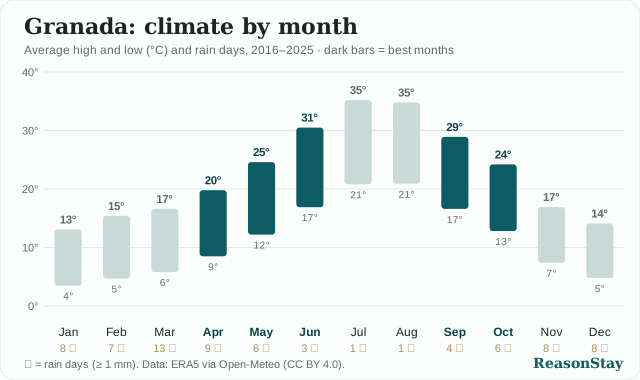
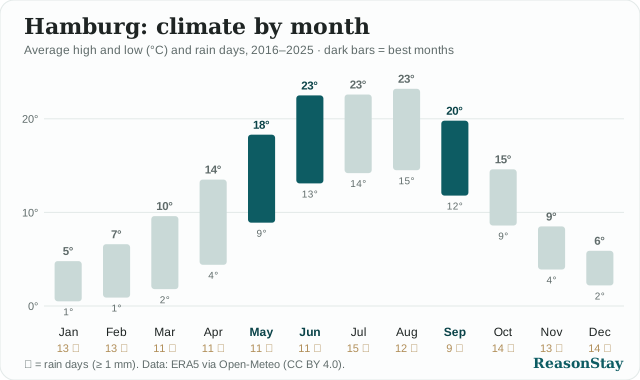
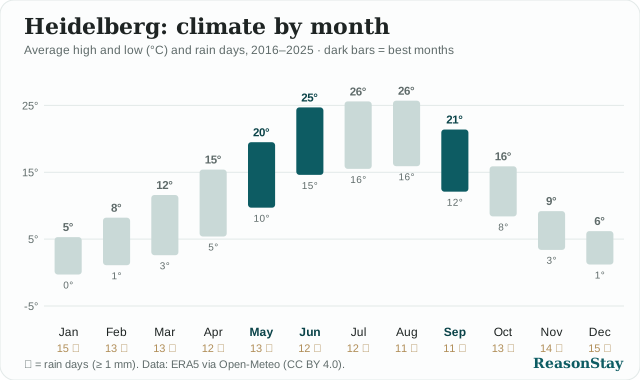
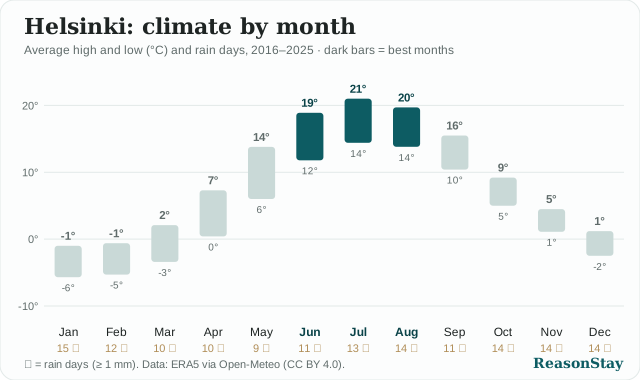
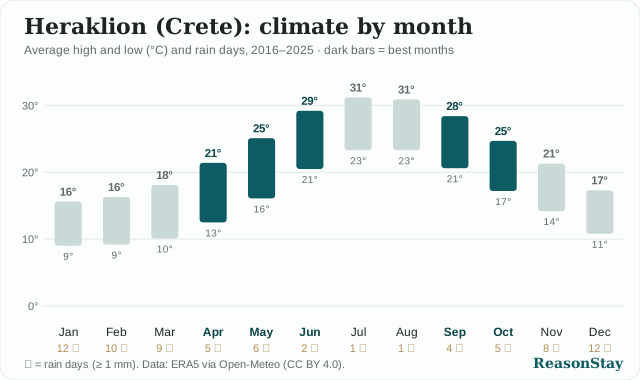
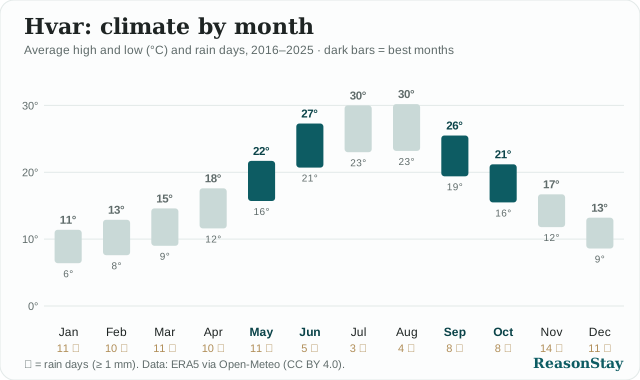
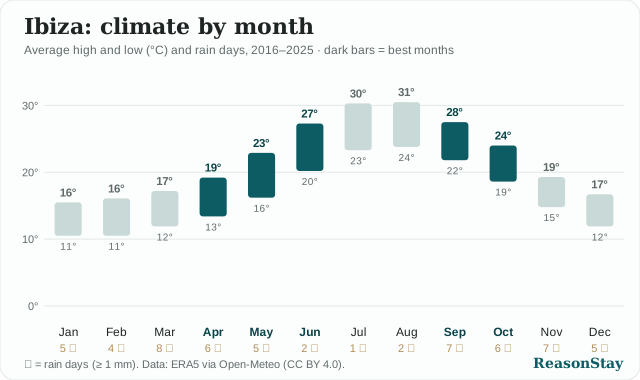
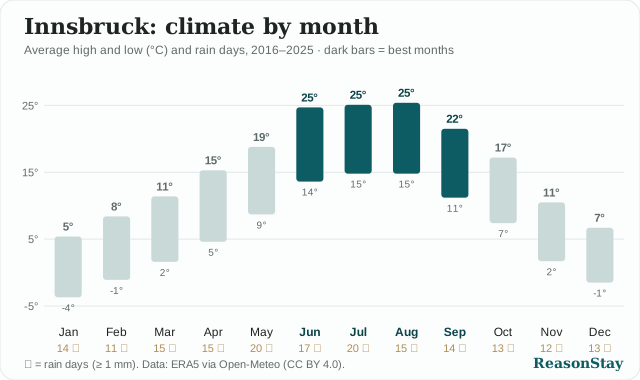
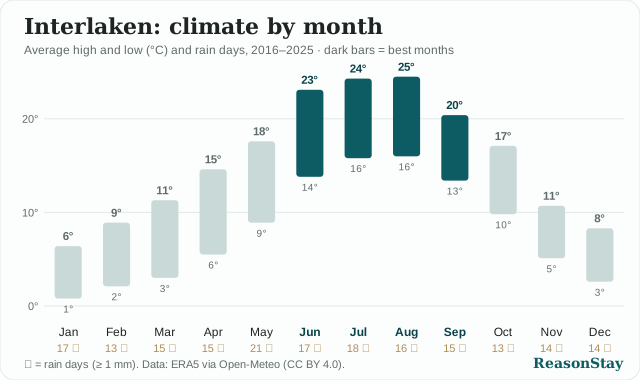
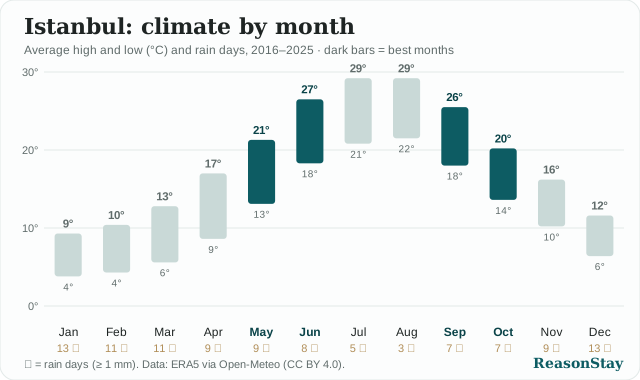
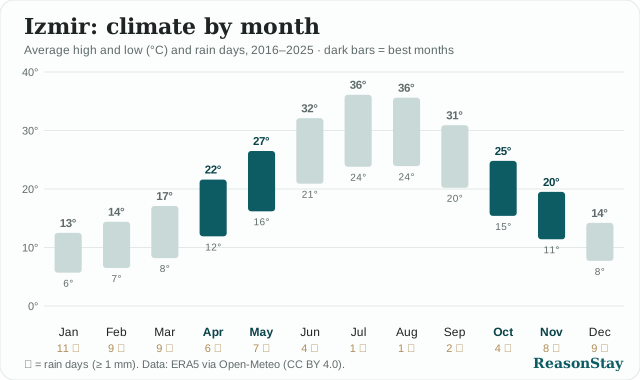
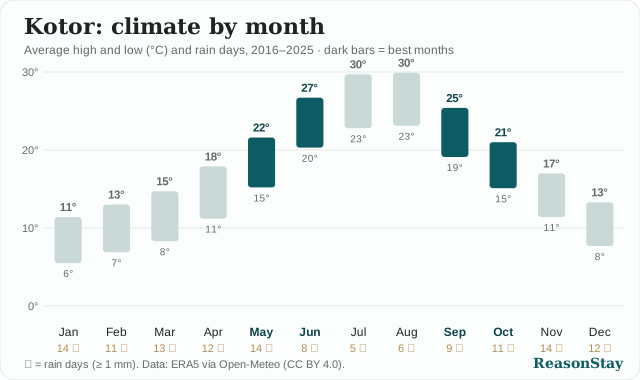
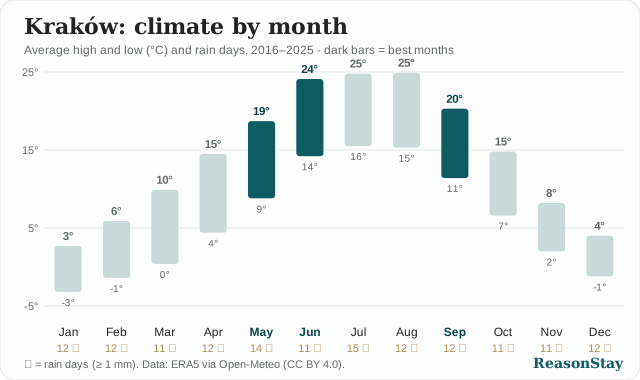
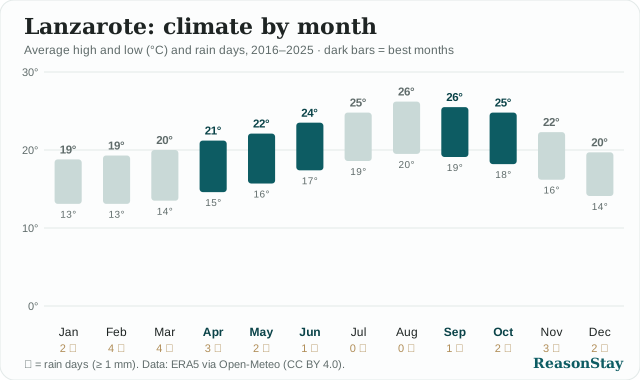
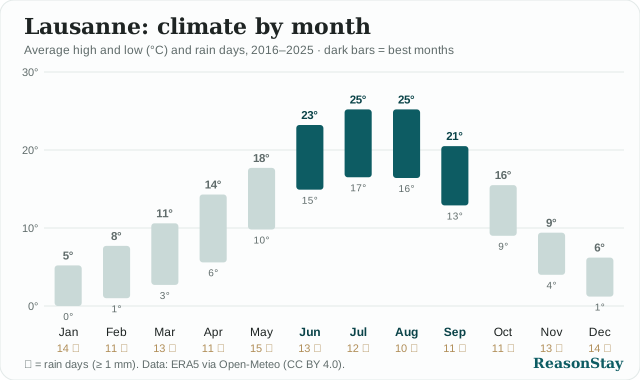
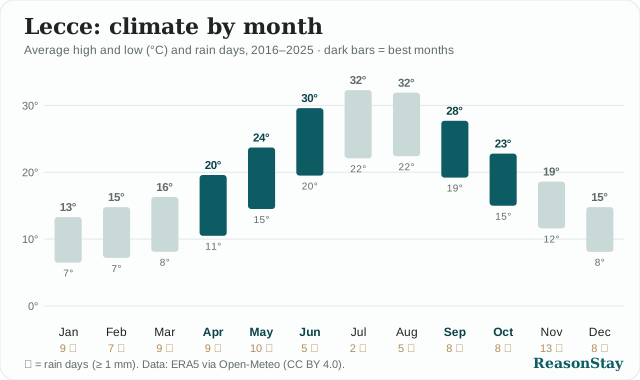
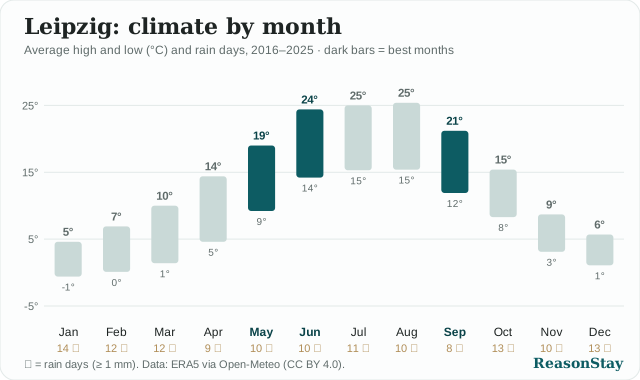
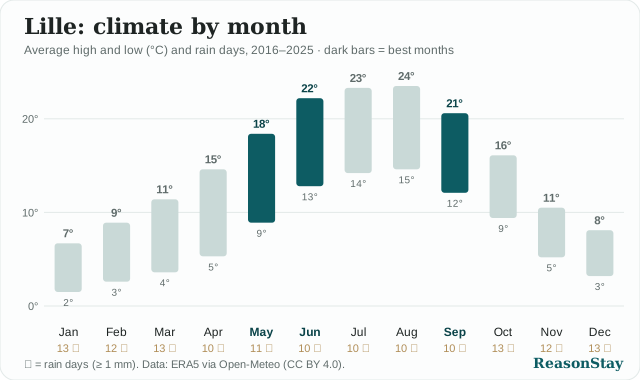
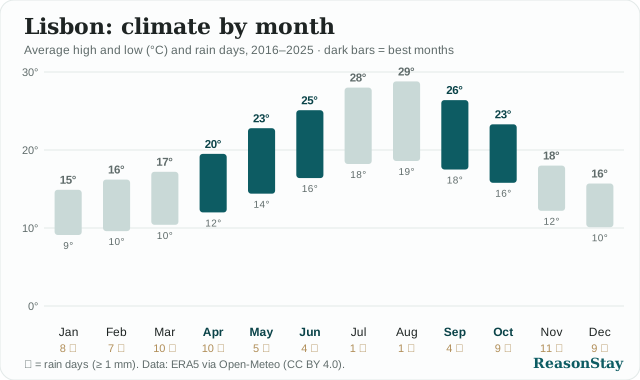
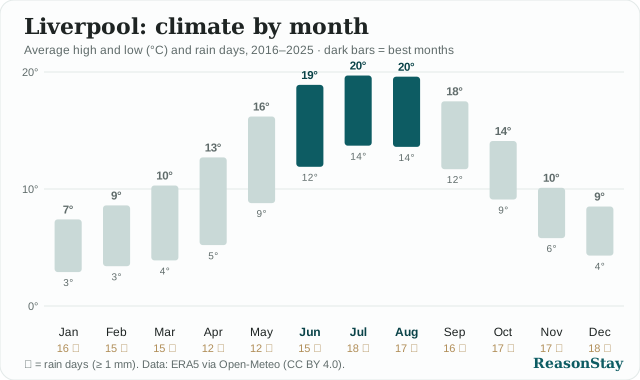
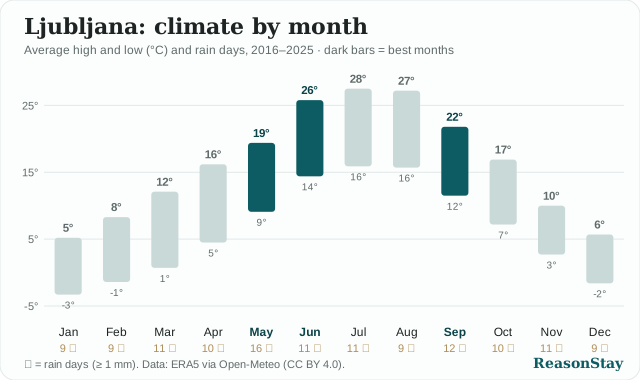
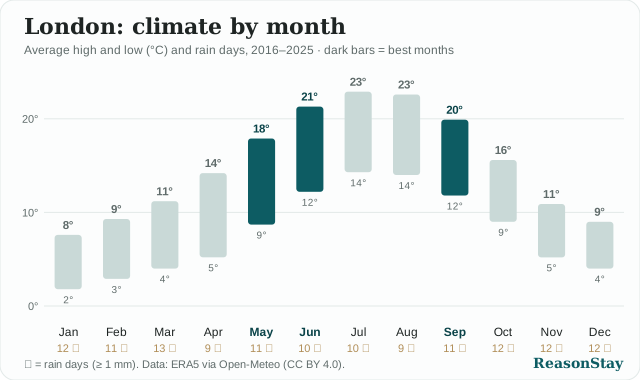
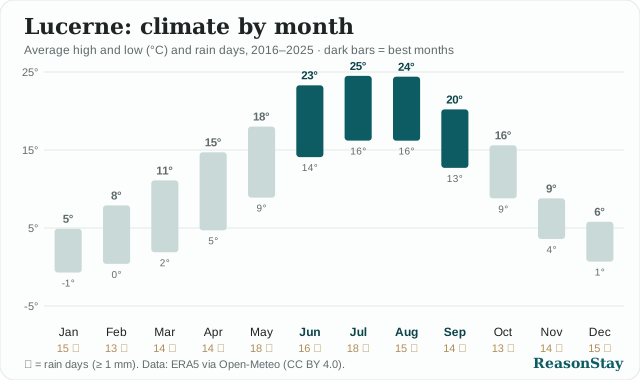
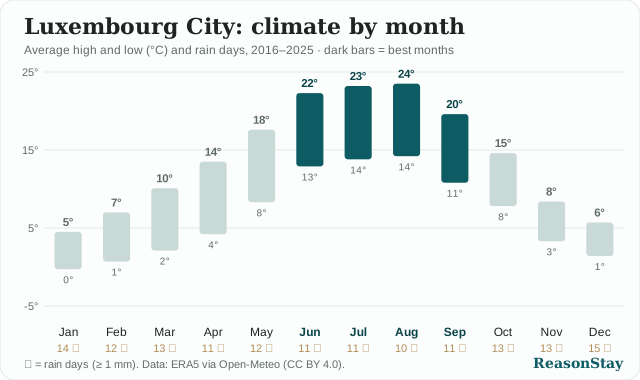
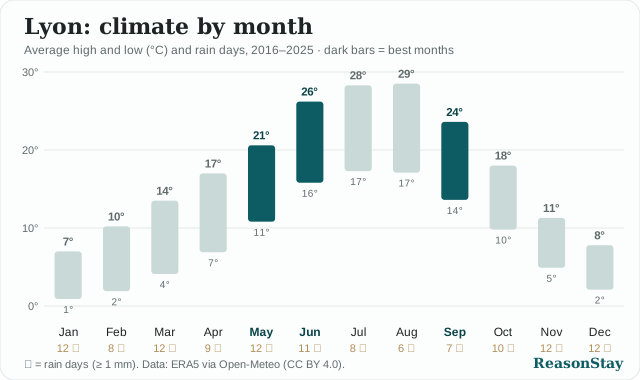
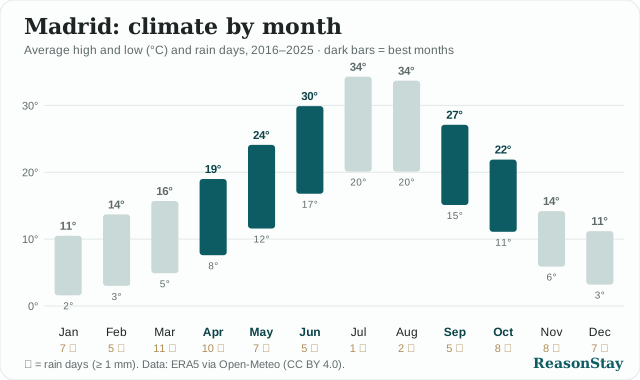
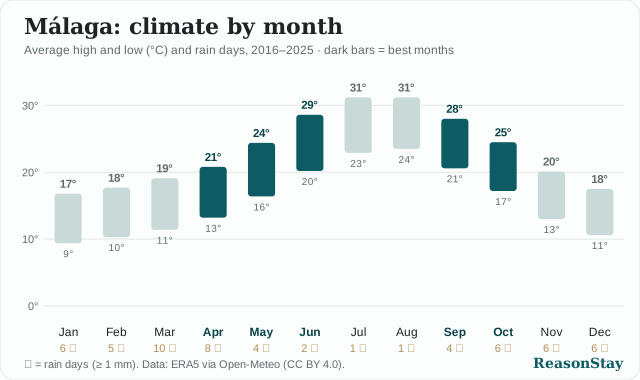
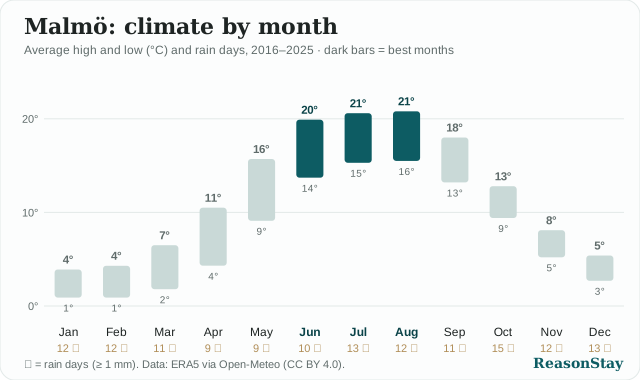
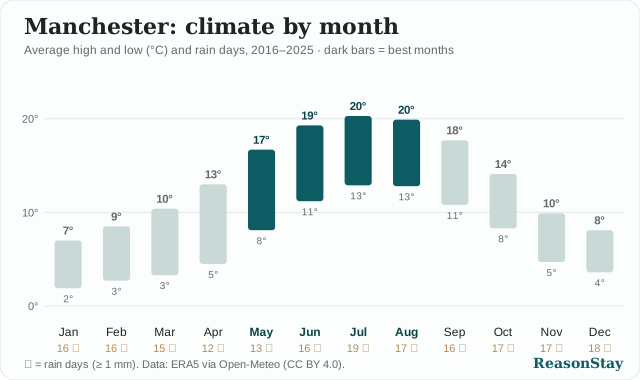
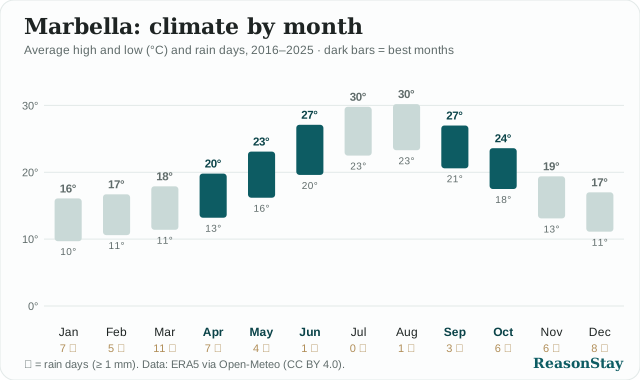
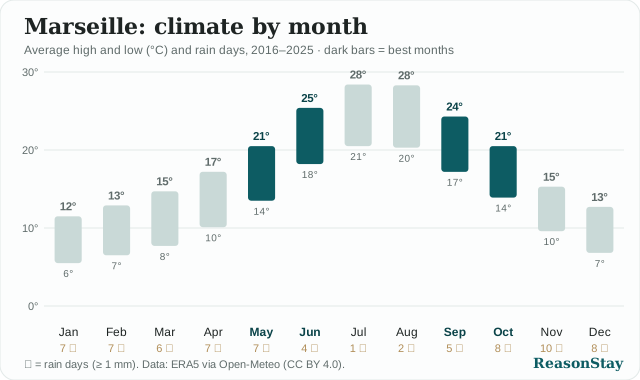
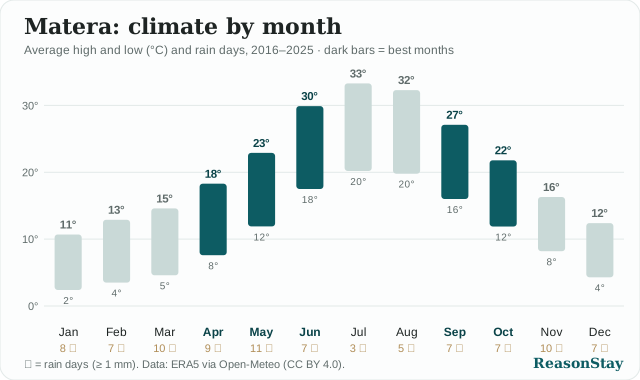
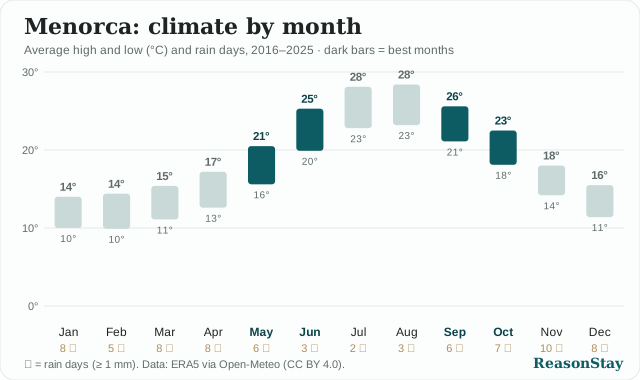
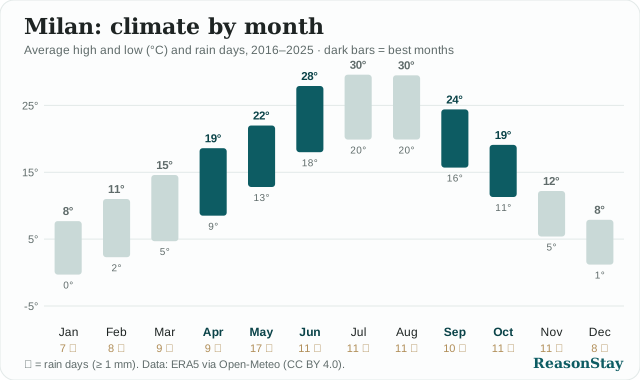
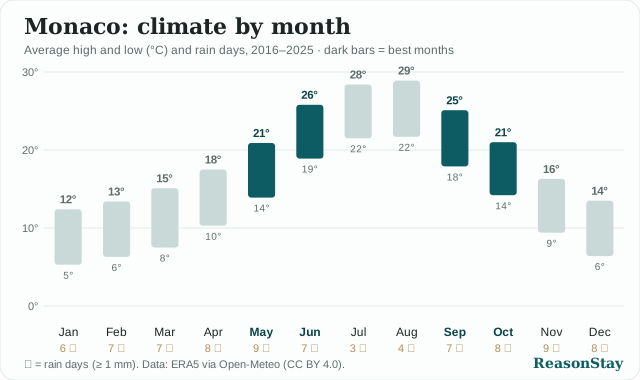
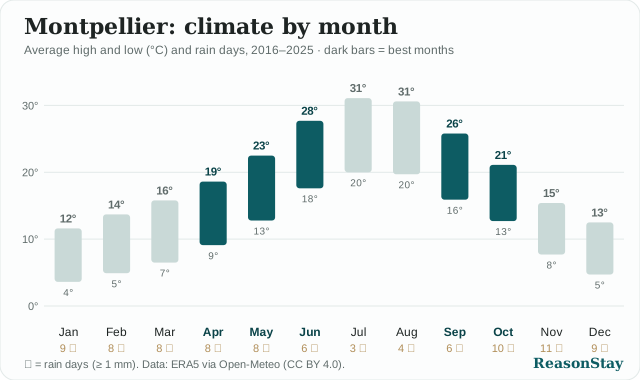
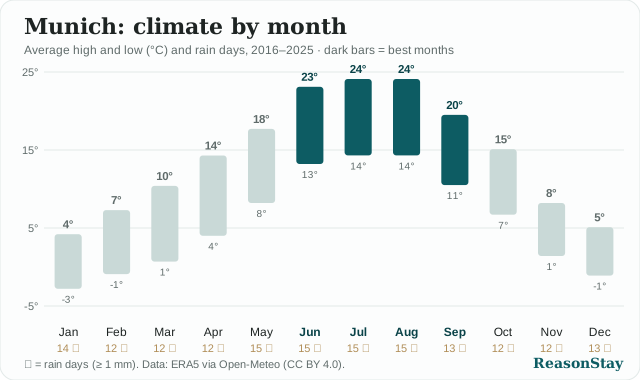
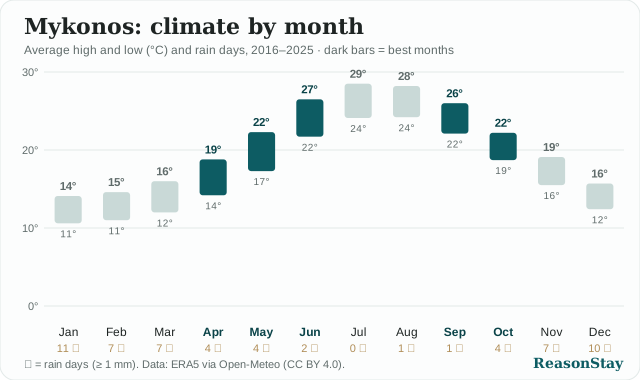
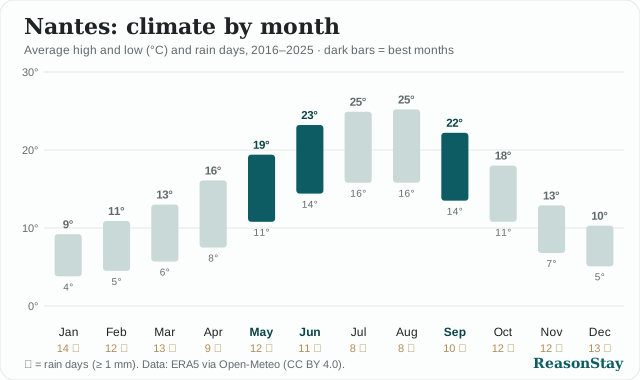
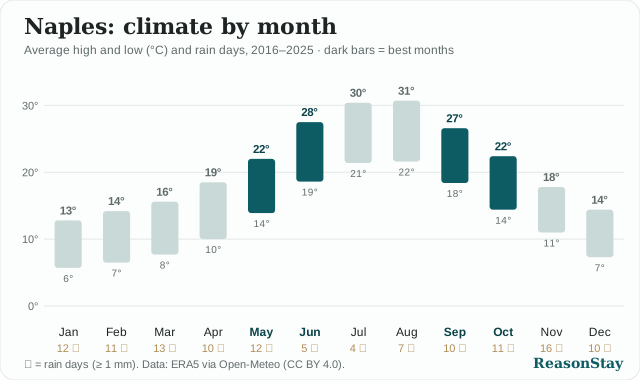
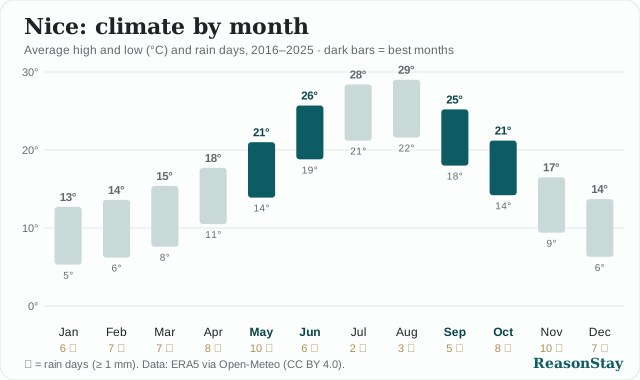
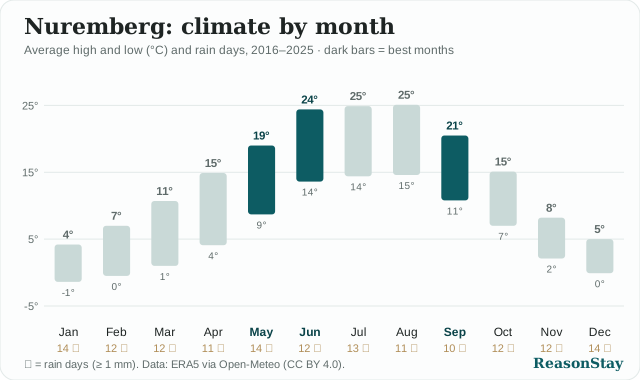
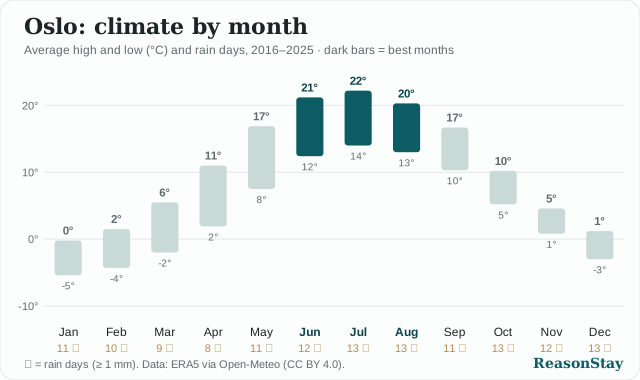
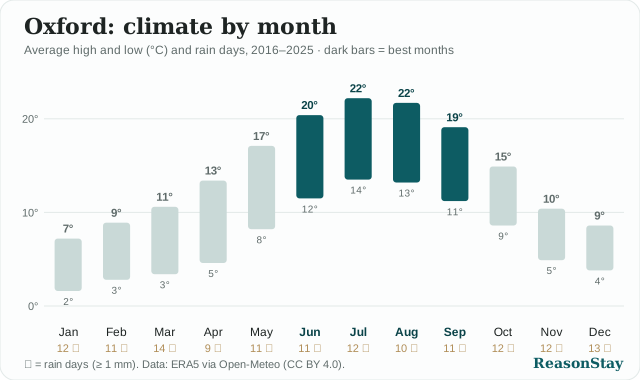
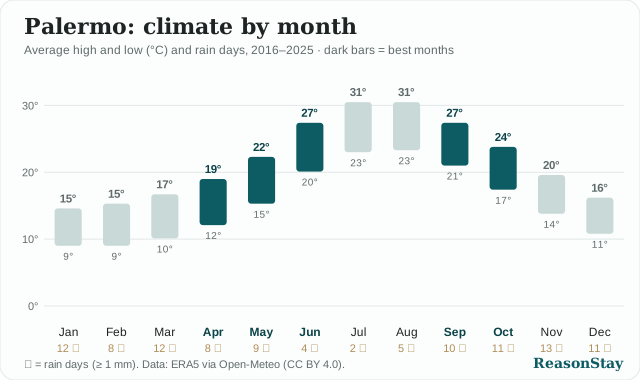
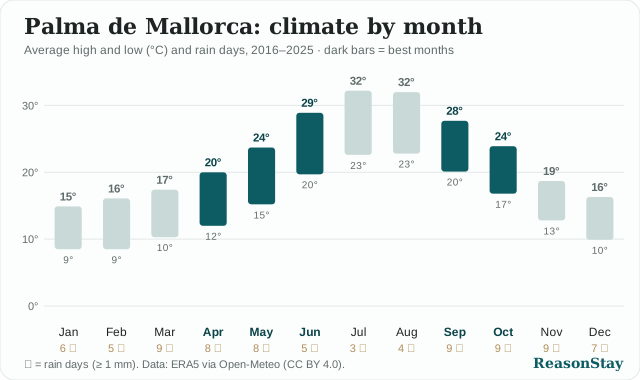
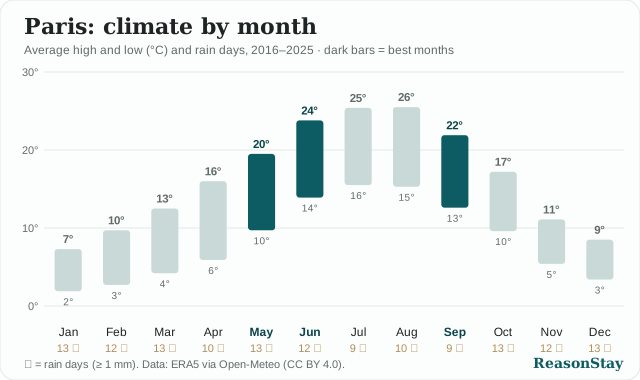
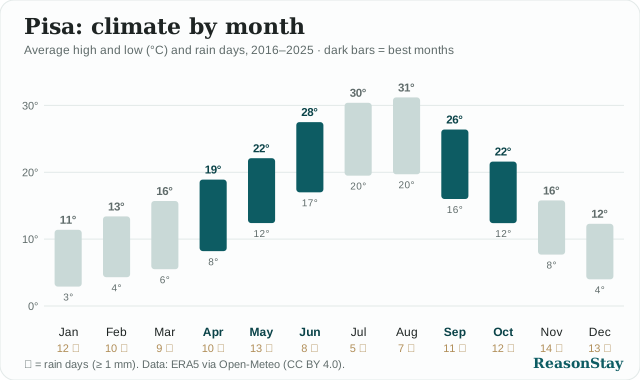
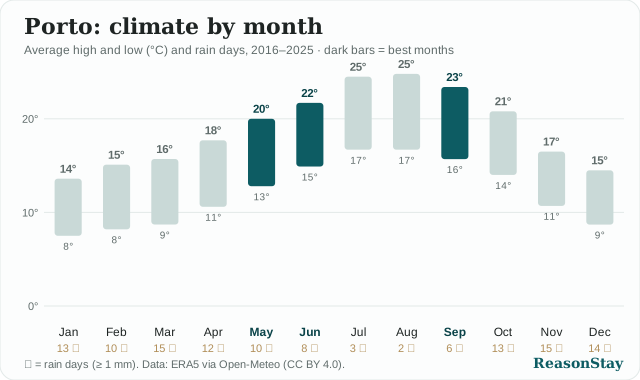
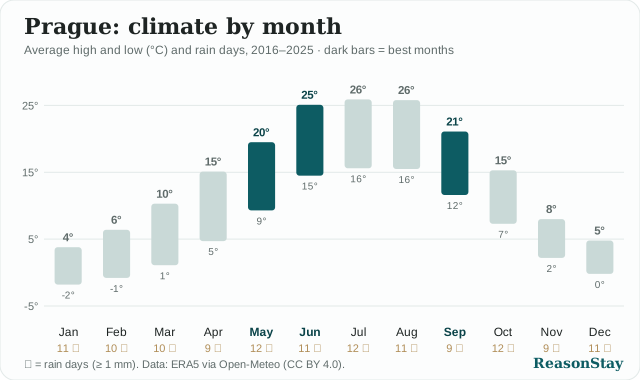
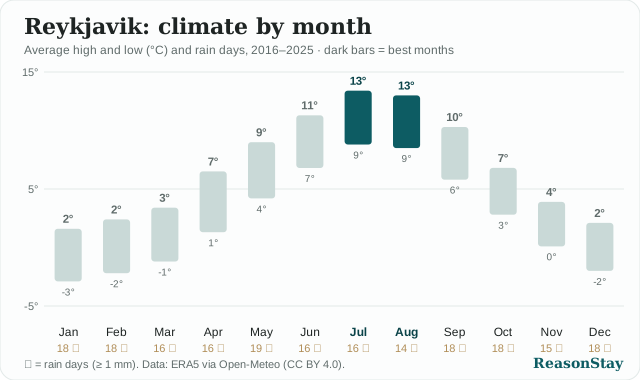
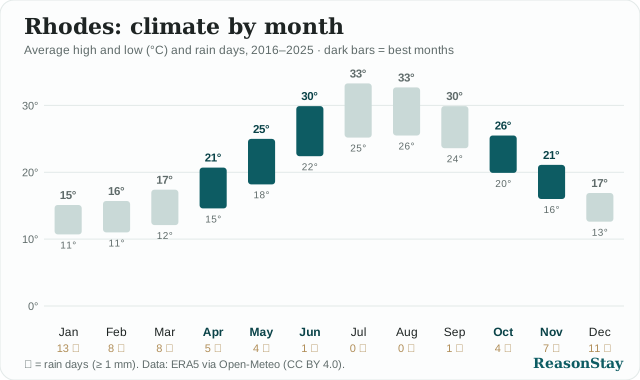
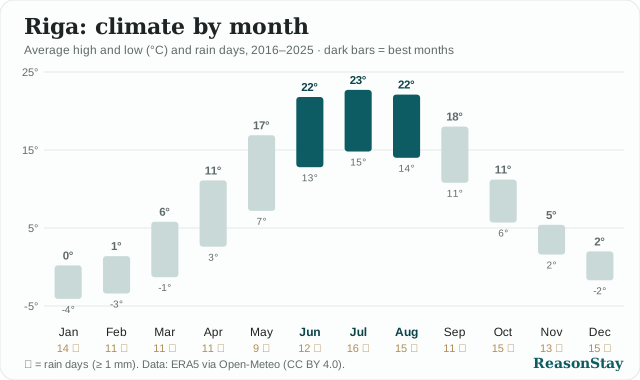
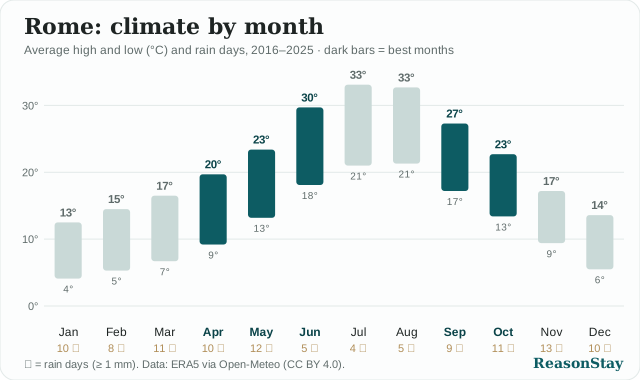
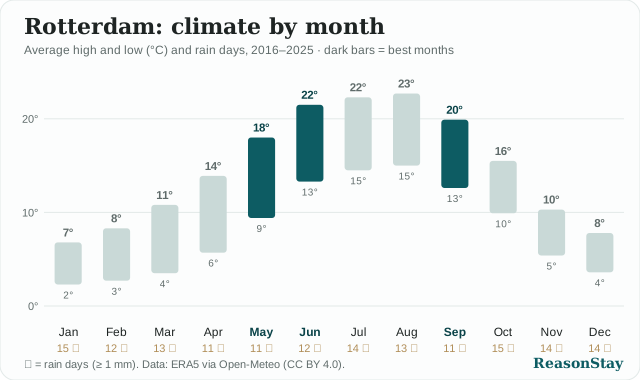
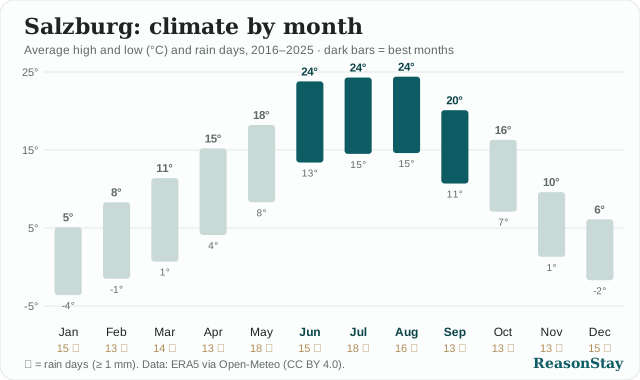
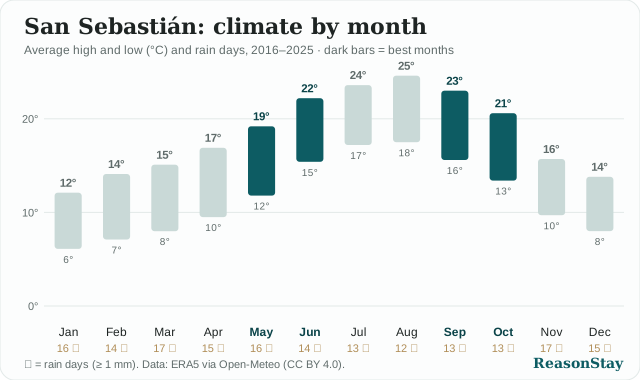
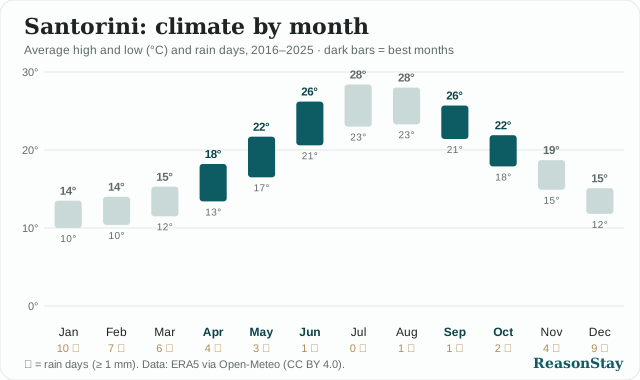
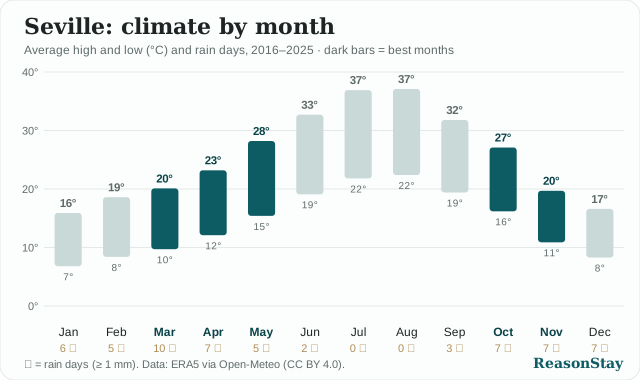
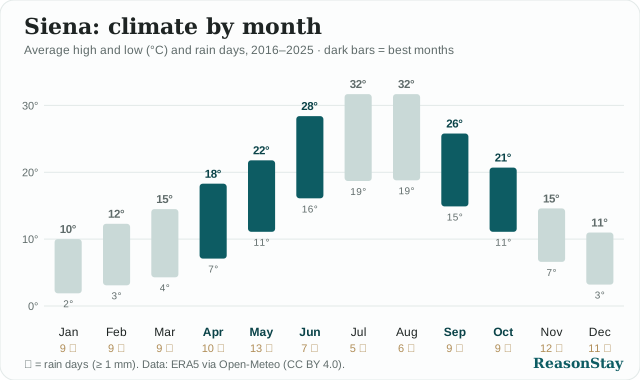
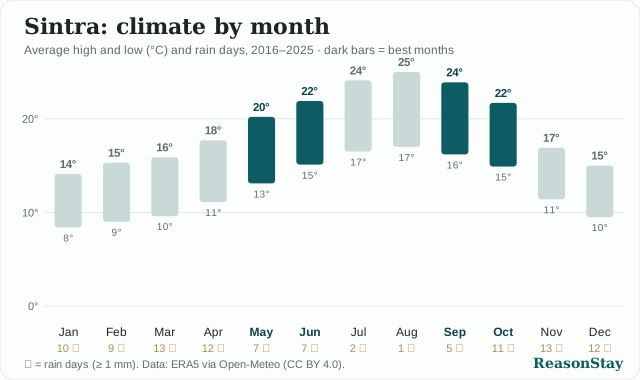
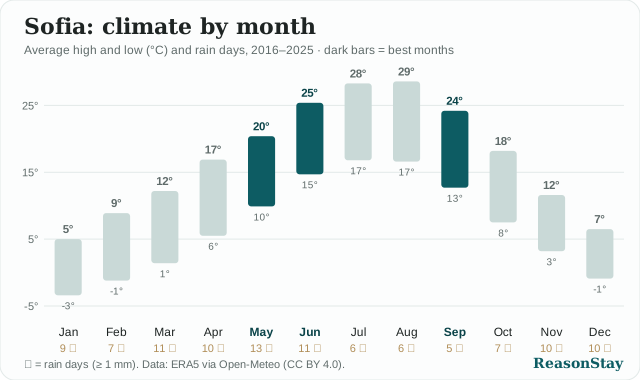
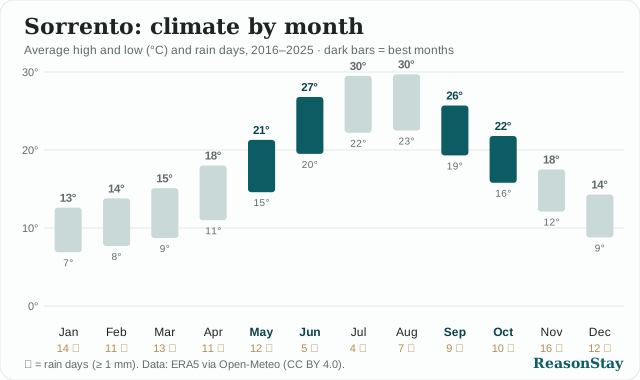
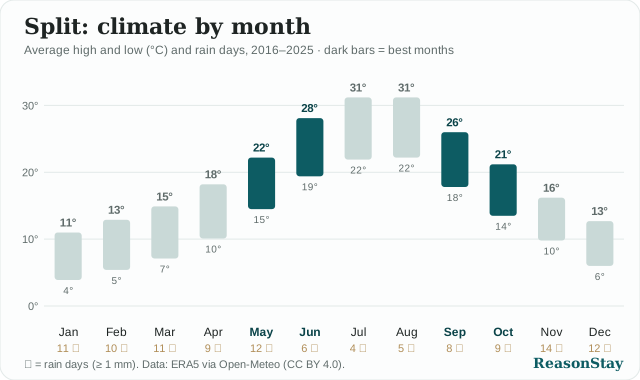
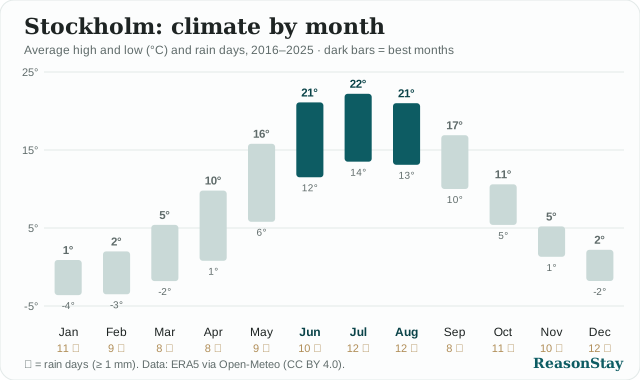
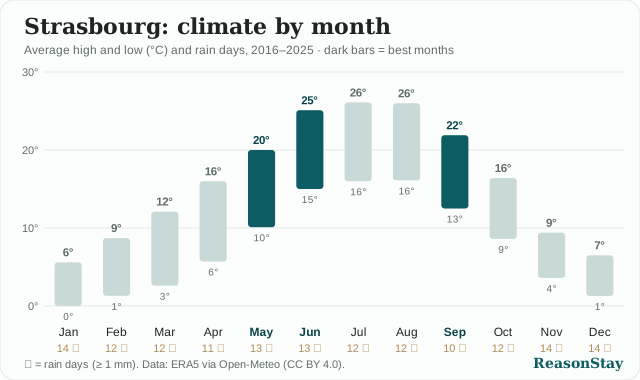
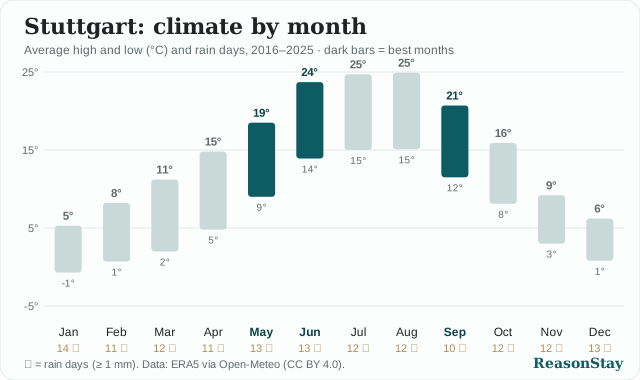
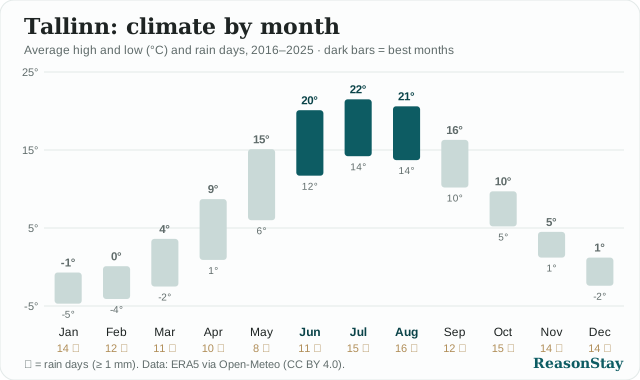
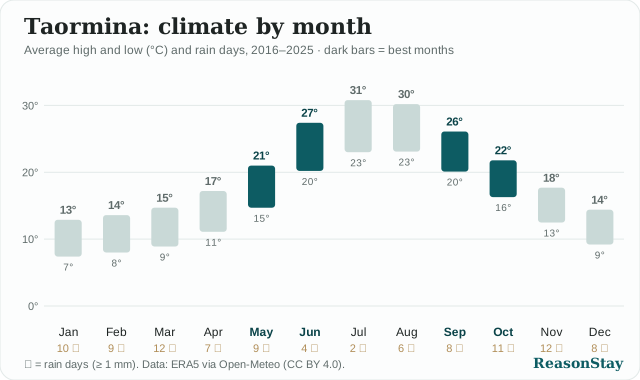
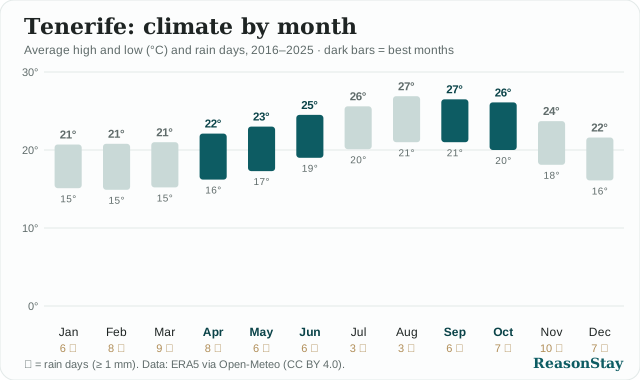
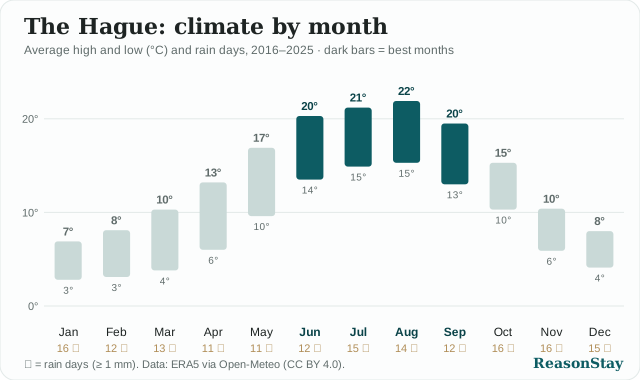
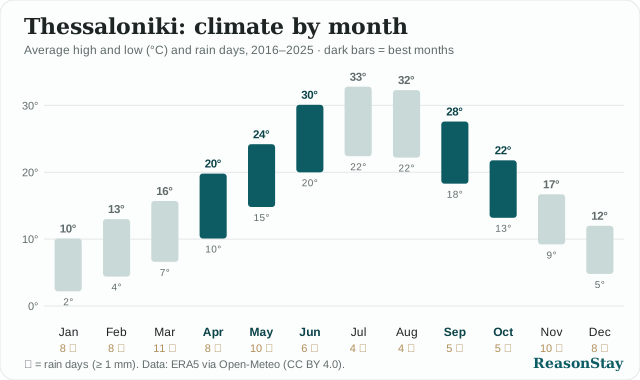
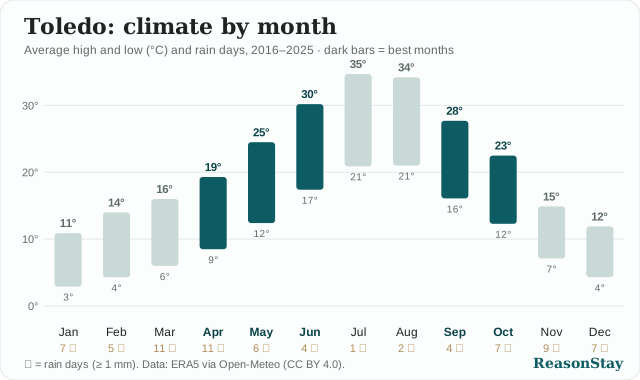
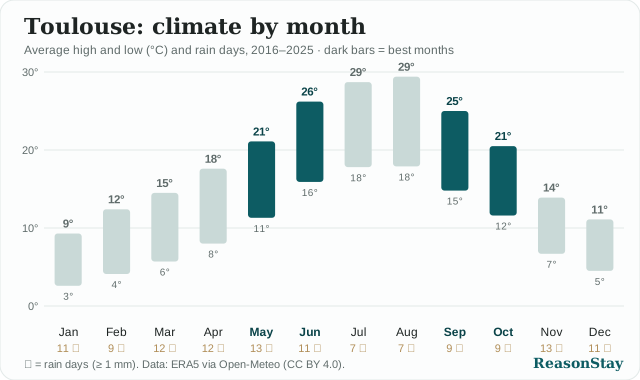
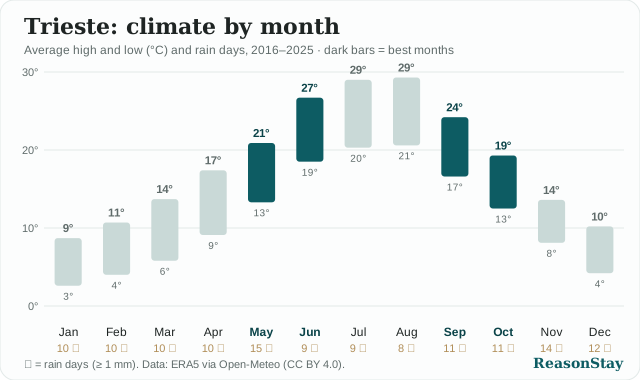
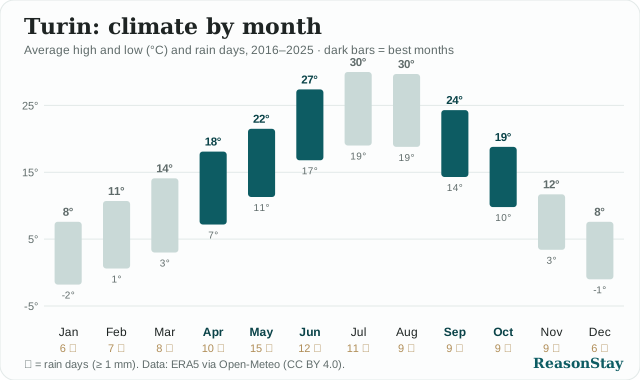
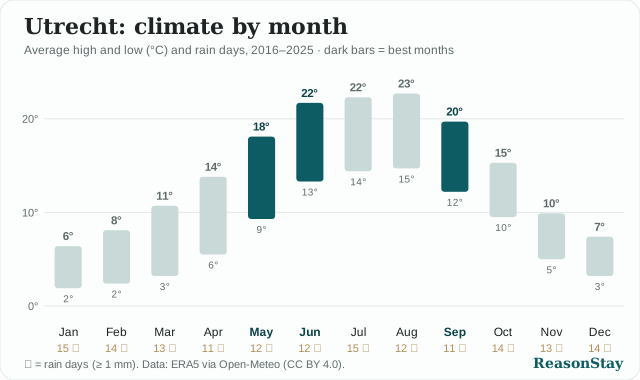
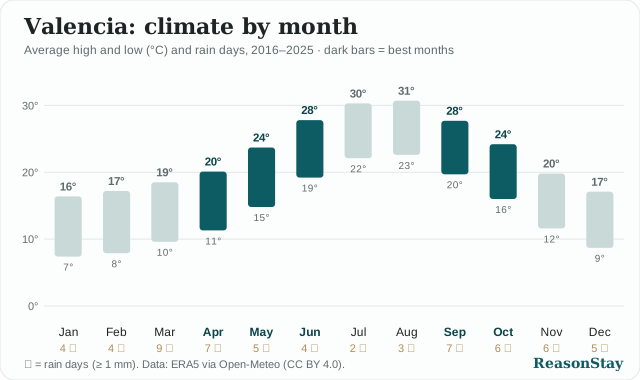
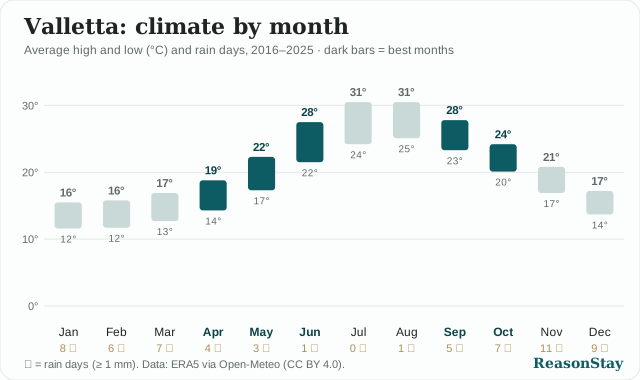
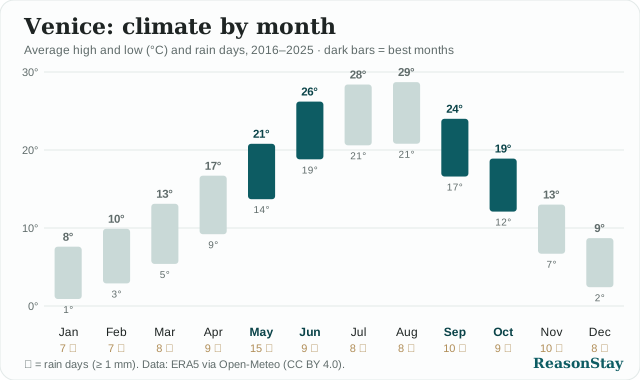
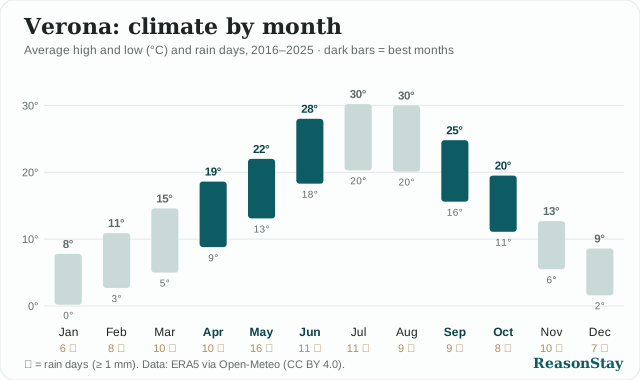
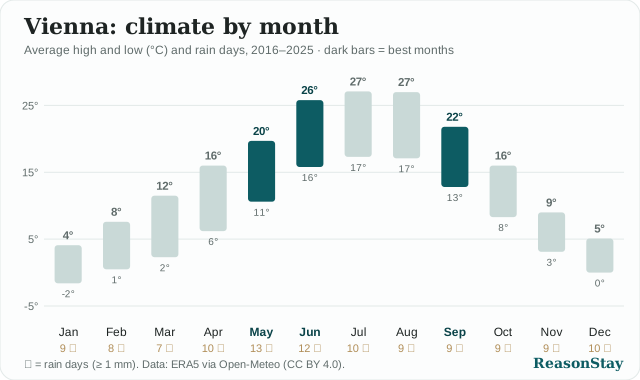
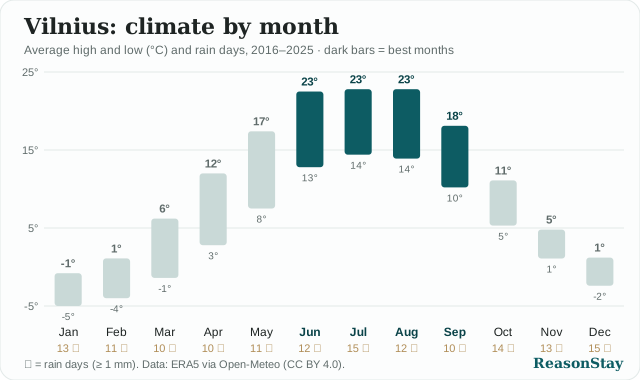
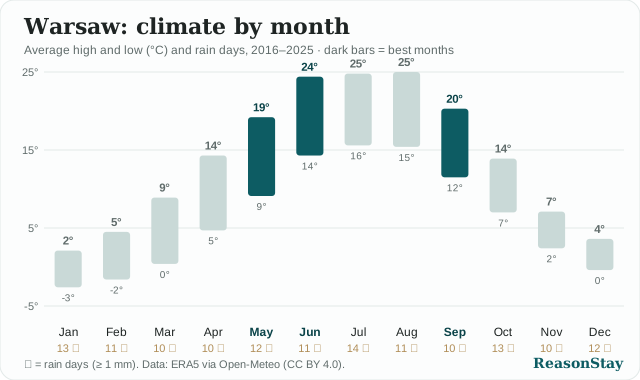
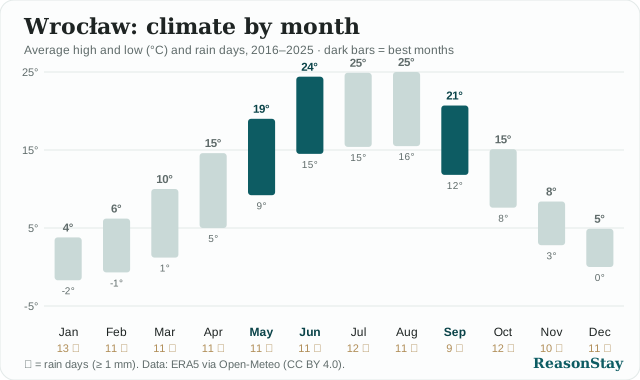
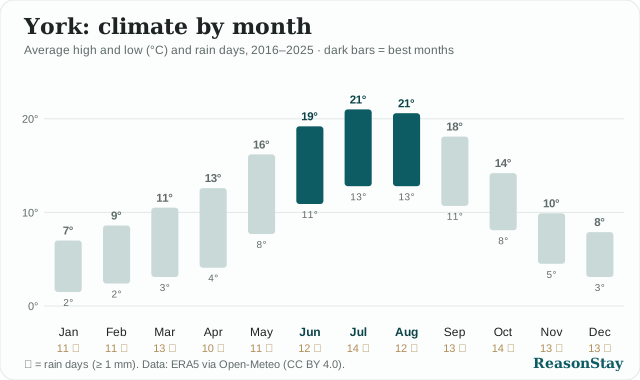
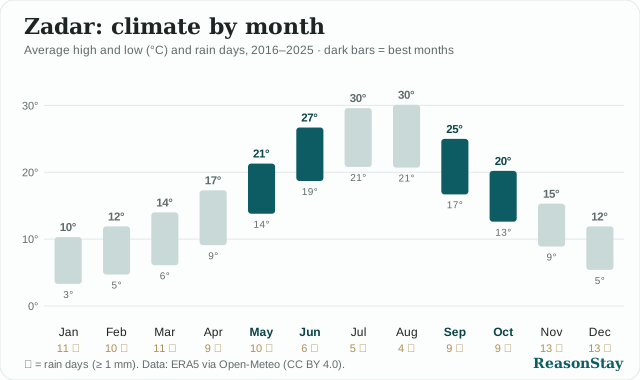
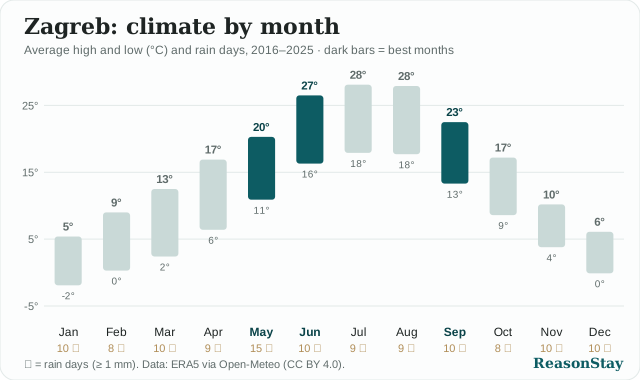
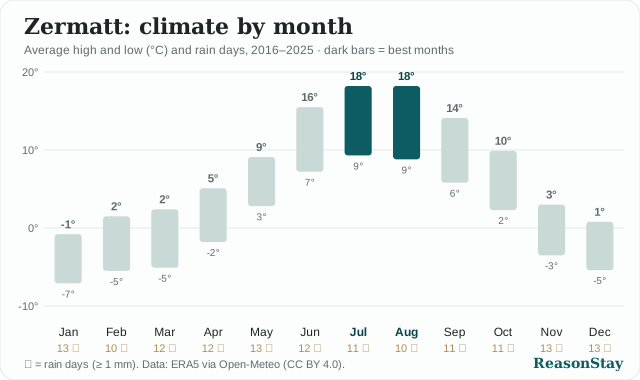
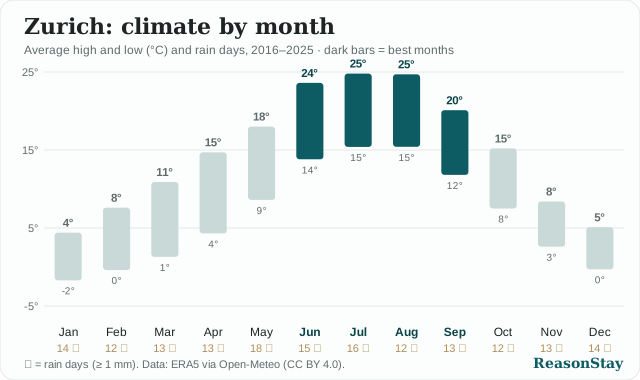
Each chart links to the city's best-time guide on ReasonStay. Charts update automatically when the data does, so the copy on your site never goes stale.