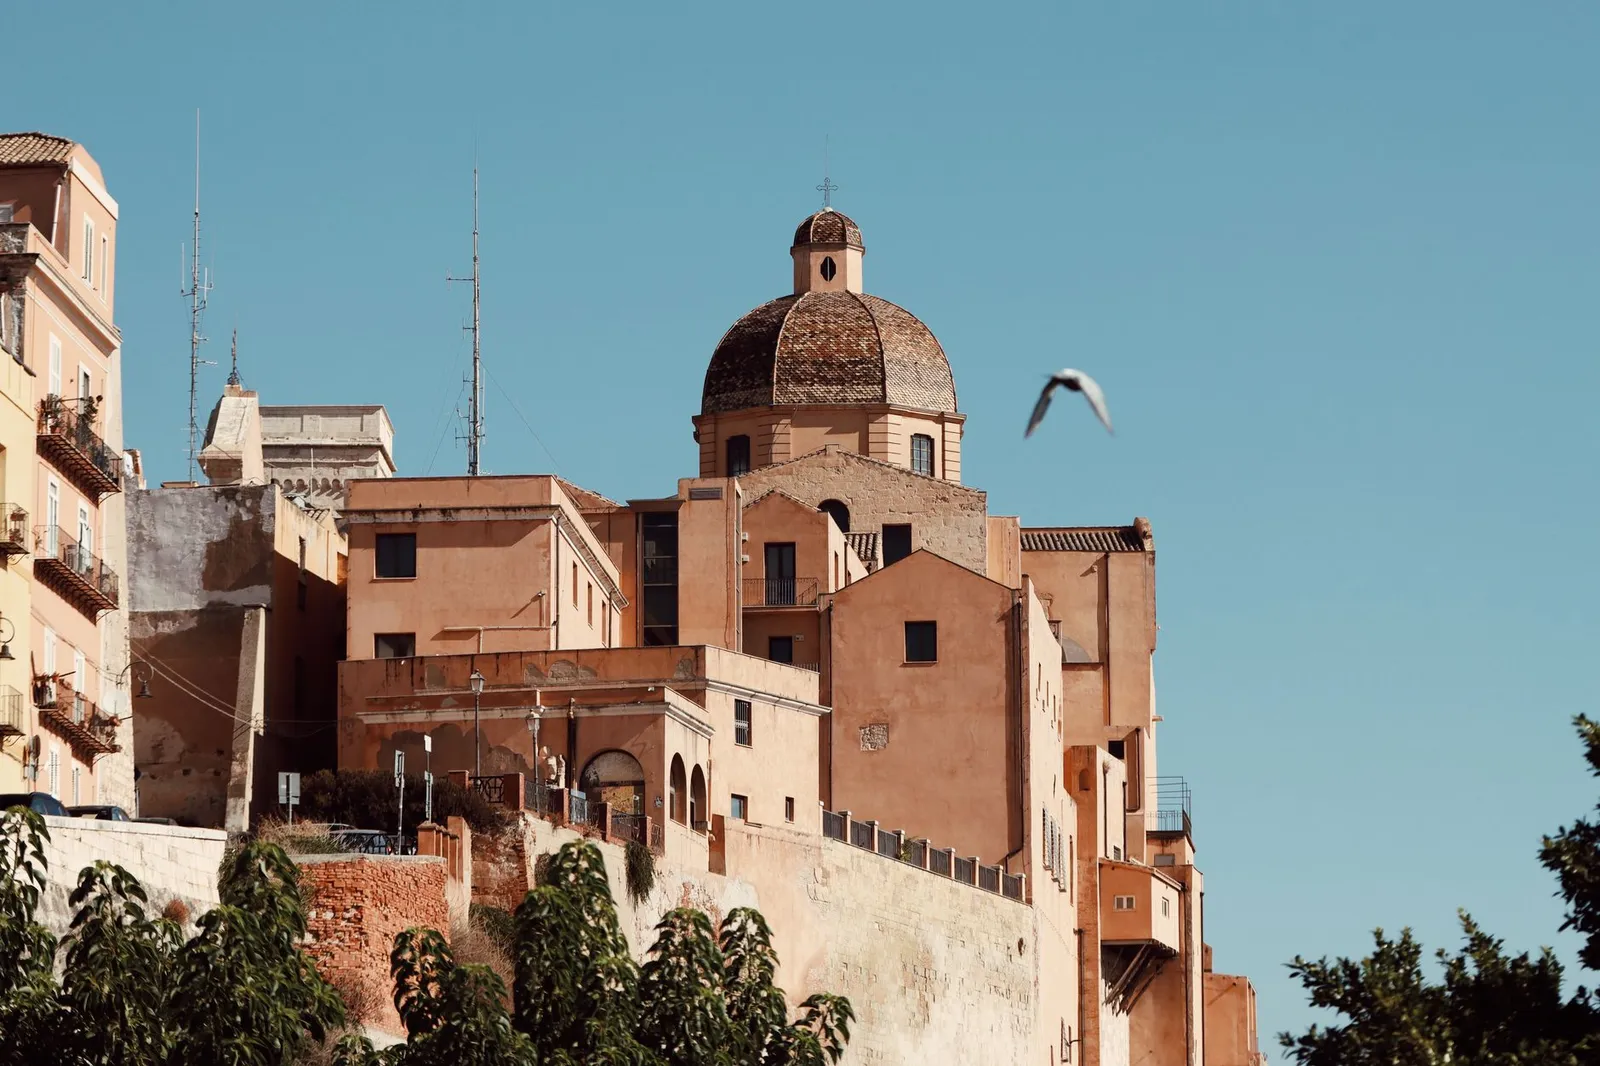
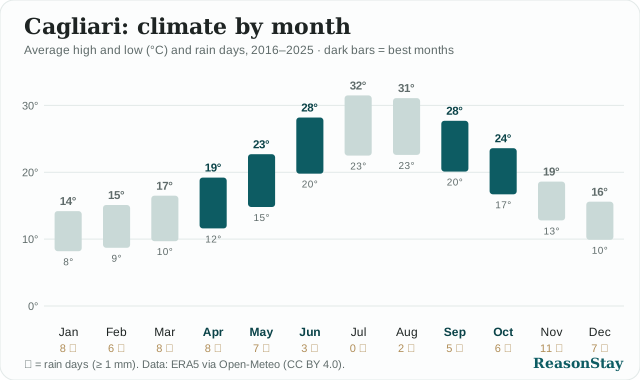
The best months to visit Cagliari are April, May, June, September and October, when average highs sit in the comfortable low-to-high-20s—May reaches 22.7 °C with 7 rain days, June warms to 28.2 °C with just 3 rain days, and October eases back to 23.6 °C with 6 rain days. July and August are peak season, when school holidays bring the heaviest crowds and the hottest weather, with highs around 31.5 °C in July. Winter from December to February is the quiet low season, cooler and wetter, but mild enough to explore the Castello quarter without the crowds.
Best months AprilMayJuneSeptemberOctober
Cagliari month by month
Average highs and lows (°C), 2016–2025. Highlighted bars are the best months.
| Month | High | Low | Rain days | Sunshine | Days ≥30 °C | Sea | Crowds |
|---|---|---|---|---|---|---|---|
| January | 14.2 °C | 8.2 °C | 8 | ●●●●● | – | 15 °C | ●●●●● |
| February | 15.1 °C | 8.7 °C | 6 | ●●●●● | – | 15 °C | ●●●●● |
| March | 16.5 °C | 9.7 °C | 8 | ●●●●● | – | 15 °C | ●●●●● |
| April | 19.2 °C | 11.6 °C | 8 | ●●●●● | – | 17 °C | ●●●●● |
| May | 22.7 °C | 14.8 °C | 7 | ●●●●● | – | 20 °C | ●●●●● |
| June | 28.2 °C | 19.8 °C | 3 | ●●●●● | 8 | 24 °C | ●●●●● |
| July | 31.5 °C | 22.5 °C | 0 | ●●●●● | 22 | 27 °C | ●●●●● |
| August | 31.1 °C | 22.6 °C | 2 | ●●●●● | 21 | 27 °C | ●●●●● |
| September | 27.7 °C | 20.1 °C | 5 | ●●●●● | 6 | 26 °C | ●●●●● |
| October | 23.6 °C | 16.7 °C | 6 | ●●●●● | – | 23 °C | ●●●●● |
| November | 18.6 °C | 12.8 °C | 11 | ●●●●● | – | 20 °C | ●●●●● |
| December | 15.6 °C | 9.9 °C | 7 | ●●●●● | – | 16 °C | ●●●●● |
How the months are picked.A month qualifies when its average high sits in the comfortable 20–28 °C band (scored down towards 9 °C and 37 °C), rain days are few and sunshine hours are high — at least 78 % of the city's best-scoring month. July and August are then set aside as peak season (school-holiday crowds and prices) whenever at least three other months qualify; where summer is the only comfortable window they stay. Figures are ten-year averages (2016-01-01 to 2025-12-31) from ERA5 reanalysis data via Open-Meteo (CC BY 4.0) for the city centre coordinates. Sunshine is shown relative to the city's own year (modelled data overstates absolute hours).Heat and sea: days with a high of 30 °C or more are averaged over 2016–2025 (ERA5); sea-surface temperature is the monthly mean 2022–2025 at the nearest open-sea grid point within about 20 km (Open-Meteo Marine).Crowds:Relative to an average month in the same region (Eurostat nights spent at tourist accommodation, by NUTS 2 region and month) — a measure of season, not of how crowded one city is compared with another. Busiest month August, quietest January; NUTS 2 region ITG2, 2022–2025, Eurostat.
Use this chart on your site
Writing about Cagliari? Add this climate chart to your article or blog for free. Keep the credit line (CC BY 4.0).
Charts for other cities: all free climate charts.
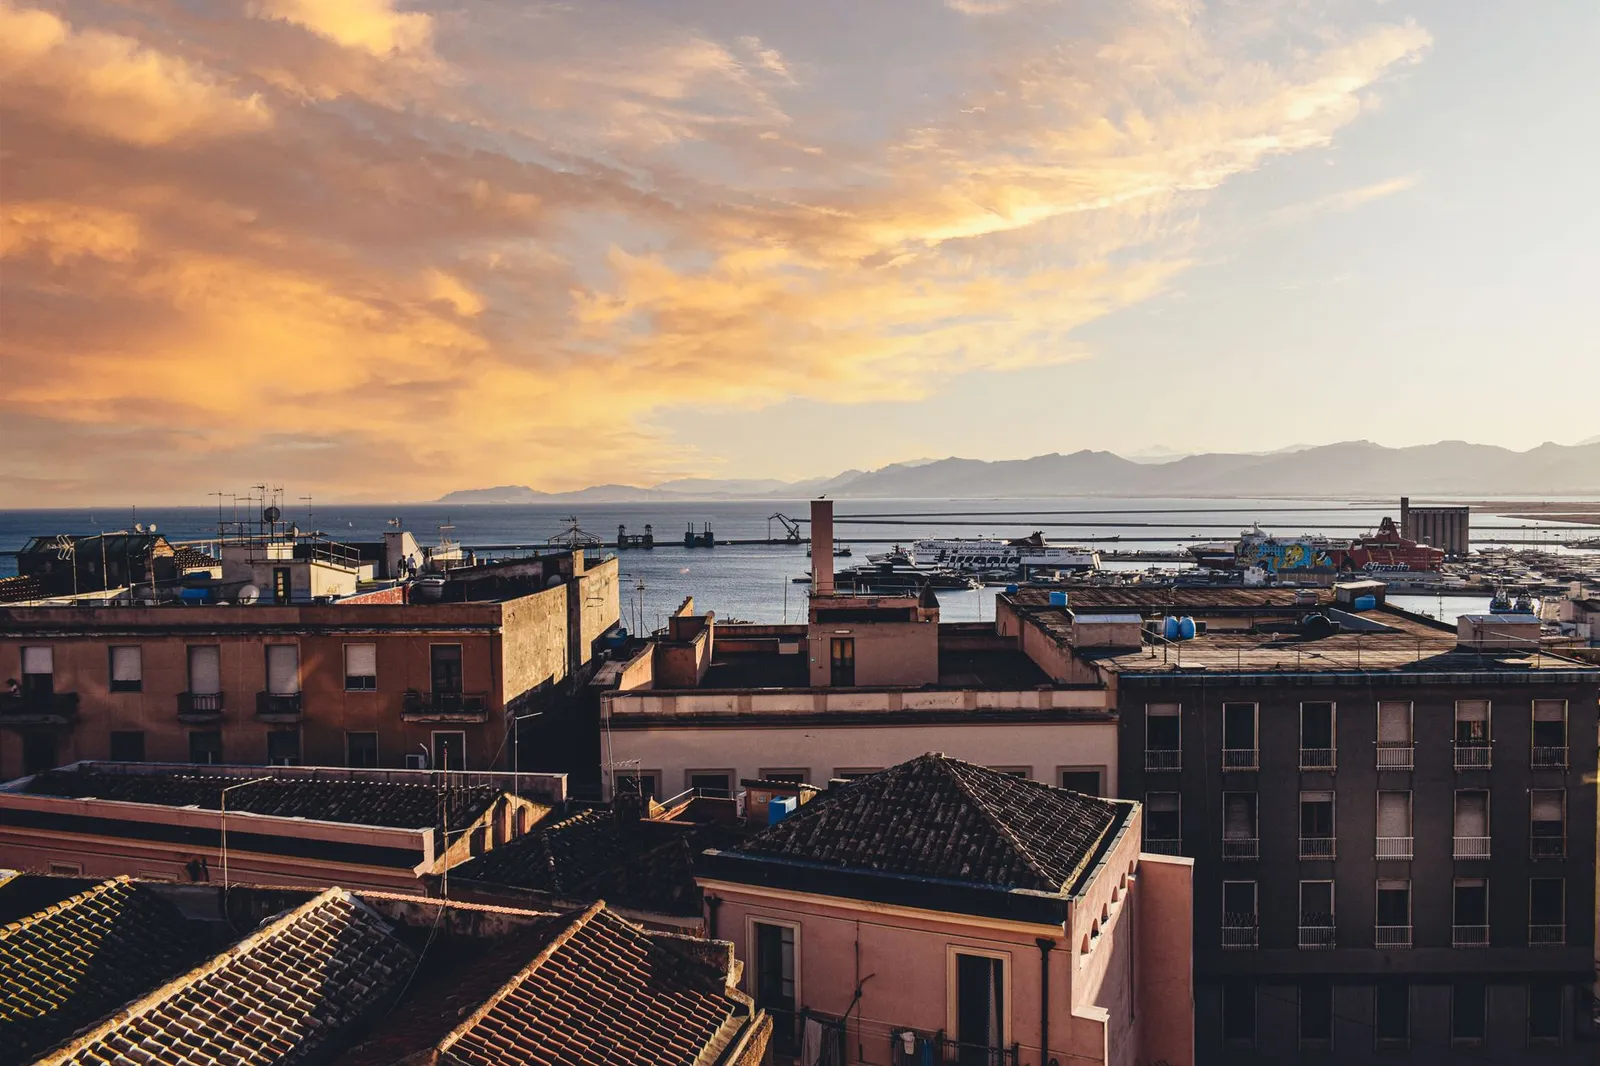
When to go, and what to expect
Spring (Mar–May)
Ideal for sightseeing and wandering Castello before the heat arrives.
Summer (Jun–Aug)
June is the sweet spot; July and August suit beach-lovers who don't mind the heat and bustle.
Autumn (Sep–Nov)
September and October are excellent for warm sea and thinner crowds.
Winter (Dec–Feb)
Worth it for low-key culture and the old town without crowds, if you skip the beach.
Notable events
- Early May (1 May)
- Sant'Efisio Festival, Sardinia's largest religious procession
- February
- Carnival celebrations
- March or April
- Easter Holy Week processions
- December
- Christmas and festive markets in the old town
Frequently asked
Is Cagliari too hot in August?
August is hot, with average highs of 31.1 °C and only 2 rain days, and it coincides with peak school-holiday crowds. If you prefer milder weather, June (28.2 °C) or September (27.7 °C) are more comfortable.
What is the rainiest month in Cagliari?
November is the wettest, with 11 rain days, followed by January and March at 8 rain days each. The driest stretch is high summer, with July at 0 rain days.
Is winter worth visiting Cagliari?
Winter is the quiet season with mild highs of 14.2–15.6 °C, though December is the least sunny month and rain is more frequent. It's good for exploring the Castello quarter crowd-free, but not for the beach.
Know when to go? Now decide where to stay — our Cagliari area guide →
Areas of Cagliari
Best time to visit near here
Sources
- Open-Meteo historical weather API — monthly climate normals, 2016–2025 (CC BY 4.0)
- ERA5 reanalysis (ECMWF / Copernicus) — the underlying temperature, precipitation and sunshine data
- ReasonStay methodology — how the best months are computed and checked
An independent guide to Cagliari — honest, verified, no invented data. Climate figures: ERA5 via Open-Meteo, 2016–2025 averages; the best months are computed from them, not opinion.